Wild Wrasse Fishery – 2021/22 Report
This report covers the Scottish wild wrasse fishery data collected in 2021 and 2022.
4. Summary of data gathered on the Scottish wrasse fishery (2021-2022)
Sixty-one derogations were issued to fish for wrasse in 2021 with 51 vessels reporting landings (via FISH1 forms and paper logs).
In 2022, sixty-three derogations were issued to fish for wrasse and 47 vessels reported landings (Table 2).
| Year | Derogations issued | Vessels reporting landings of wrasse |
|---|---|---|
| 2017 | NA | 33 |
| 2018 | NA | 43 |
| 2019 | NA | 51 |
| 2020 | NA | 63 |
| 2021 | 61 | 51 |
| 2022 | 63 | 47 |
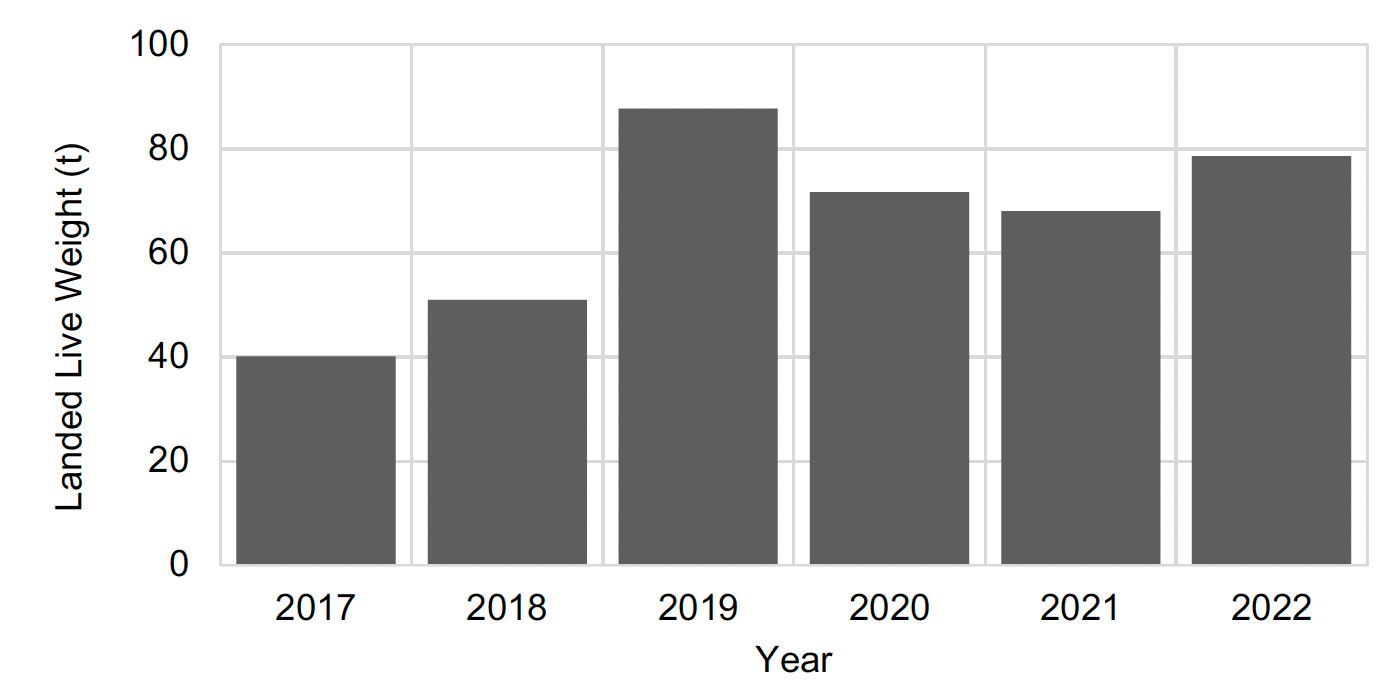
Based on the reported data (FISH1 and paper logs), the total landings recorded for wrasse (all species combined) increased between 2017 and 2022. In 2017, wrasse landings were 40.1 tonnes and increased over the following two years to a peak of 87.7 tonnes in 2019 (Figure 1). During 2020 and 2021 the landings decreased slightly but increased again to 78.6 tonnes in 2022.
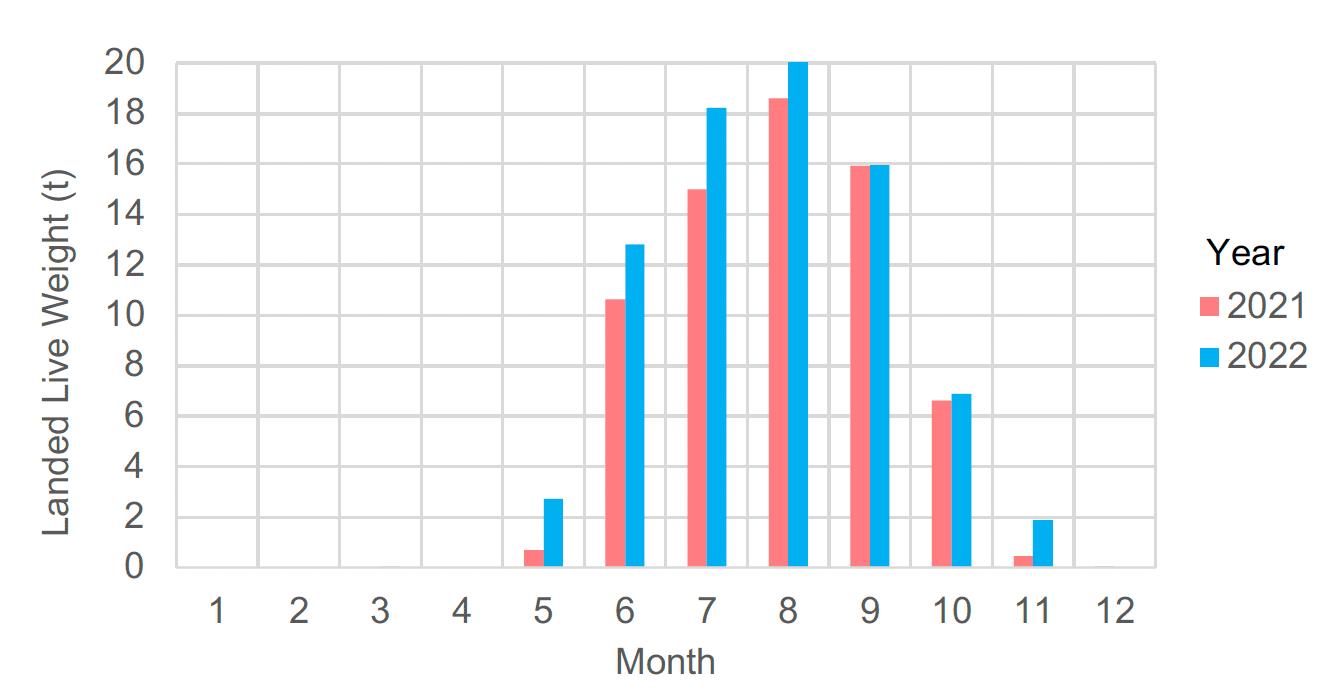
The wrasse fishery takes place between May and November. In 2021 and 2022 wrasse landings were highest in quarter three (July-September; Figure 2). The very small quantity of wrasse reported to be landed outwith the fishery season was due to incorrectly reported landing dates.
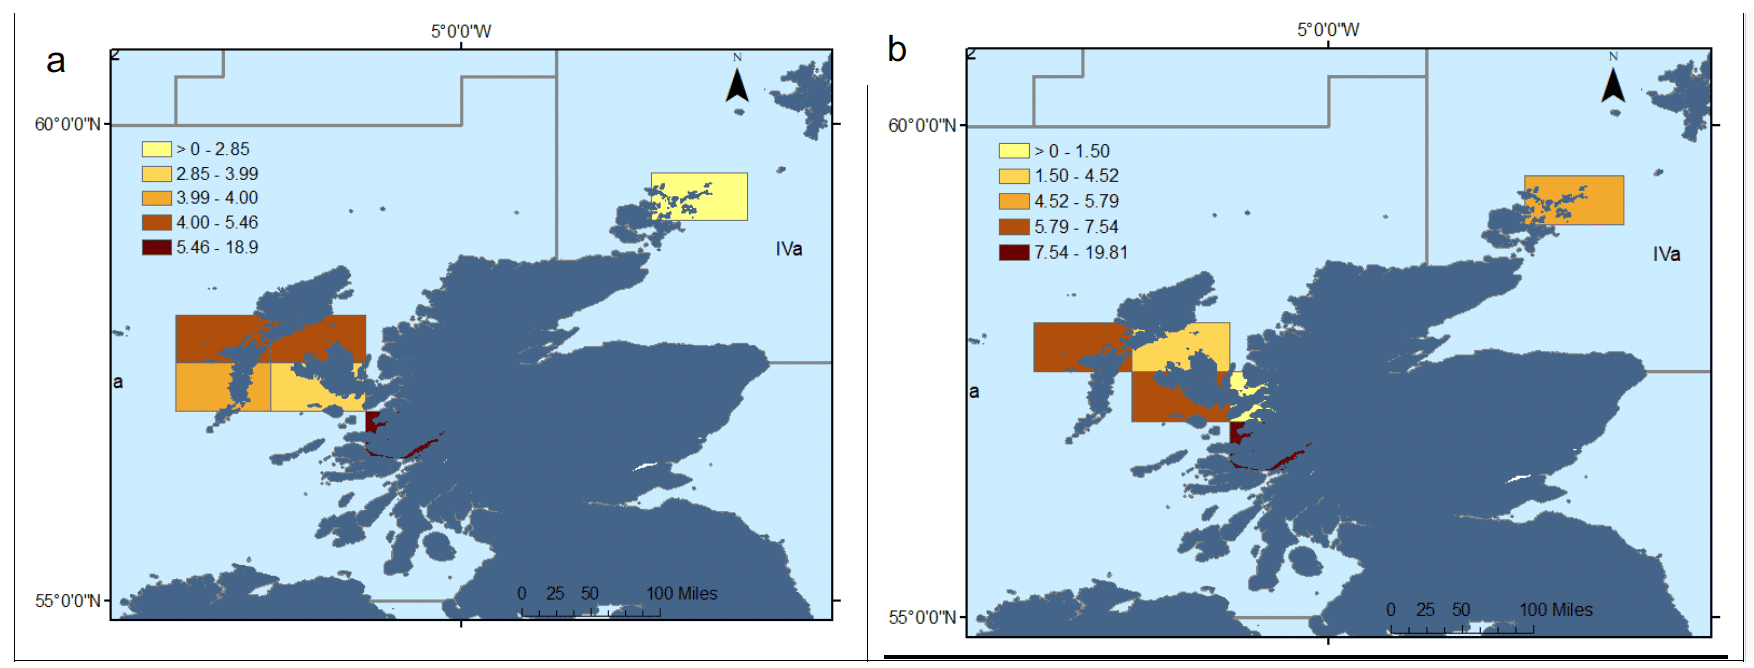
The highest landings of wrasse (by weight) were reported for the West Coast of Scotland (in 2021 and 2022), with some fishing activity also recorded around Orkney Islands (Figure 3) and to a lesser extent in the Moray Firth and Shetland Islands. ICES rectangles with landings reported from fewer than 5 vessels to that square are not displayed on the map. Further information regarding landings by ICES statistical square from 2017-2022 can be found in Appendix 1 – Table A1.1
Ballan wrasse are typically the most common species of wrasse reported and contributed between 39.3% and 80.6% of the landings (by weight) between 2017 and 2022 (Table 3). Corkwing wrasse contributed to 14.6% of the landings in 2021 and 11.6% of the landings in 2022. For detailed information on the number and percentage of wrasse landed by species during 2021 and 2022 please refer to Appendix 1, Table A1.4.
| Species | 2017 | 2018 | 2019 | 2020 | 2021 | 2022 |
|---|---|---|---|---|---|---|
| Ballan | 74.5 | 74.6 | 39.3 | 60.8 | 73.0 | 80.6 |
| Corkwing | 6.3 | 8.6 | 12.5 | 14.7 | 14.6 | 11.6 |
| Goldsinny | 14.4 | 10.8 | 34.8 | 7.7 | 7.8 | 4.3 |
| Rock cook | 0.9 | 2.5 | 1.2 | 6.0 | 2.0 | 1.2 |
| Wrasses | 3.9 | 4.4 | 12.2 | 10.8 | 2.7 | 2.4 |
To provide an approximation of the retention and return rates, fishers also provided counts from the first 20 pots lifted on each fishing trip. Fishers report the number of fish retained of permitted size, and fish returned to the sea (under, over or permitted size) for each species. The total percentage of wrasse of permitted sizes and retained (landed) was 51.5% for 2021 and 40.0% for 2022 (Table 4, numbers reported in Appendix 1 Table A1.2). Of the 60% of the fish that were returned in 2022, 30.3% of the wrasse were undersized, 5.7% were oversized and 24.1% were of permitted size.
| Species | Ballan | Corkwing | Cuckoo | Goldsinny | Rock Cook | Total |
|---|---|---|---|---|---|---|
| Returned (%) undersize 2021 | 10.5 | 30.2 | 36.2 | 39.6 | 55.2 | 26.8 |
| Returned (%) undersize 2022 | 12.3 | 27.1 | 24.0 | 39.0 | 56.8 | 30.3 |
| Returned (%) oversize 2021 | 6.0 | 7.7 | 9.0 | 5.5 | 2.2 | 5.7 |
| Returned (%) oversize 2022 | 13.5 | 3.6 | 3.8 | 0.5 | 0.3 | 5.6 |
| Returned (%) permitted 2021 | 2.9 | 22.2 | 33.7 | 34.4 | 14.3 | 15.9 |
| Returned (%) permitted 2022 | 4.4 | 35.6 | 56.7 | 38.0 | 22.3 | 24.1 |
| Retained (%) permitted 2021 | 80.5 | 40.0 | 21.2 | 20.5 | 28.3 | 51.5 |
| Retained (%) permitted 2022 | 69.8 | 33.8 | 15.6 | 22.5 | 20.6 | 40.0 |
Contact
Email: inshore@gov.scot
There is a problem
Thanks for your feedback