Young Person's Guarantee - employment and education landscape: current evidence - overview
This evidence paper provides an overview of the current evidence on the employment and education landscape for young people aged 16 to 24 in Scotland, with equalities and Scottish Index of Multiple Deprivation (SIMD) breakdowns provided where possible.
5. University
This chapter examines the available data on those aged 16 to 24 who go to university.
Number of university enrolments by those aged 16 to 24
In the five years up to 2019/20, the overall number of university enrolments for 16 to 24 year olds rose from around 151,500 in 2014/15 to 168,500 in 2019/20 (up 11.2%), as shown in Table 5.1.
The greatest increase was in the number of first degree enrolments (up 11,200) but the greatest proportional increase was the number of taught postgraduate enrolments (up 43.5%). The number of enrolments for postgraduate research courses increased by 5.5% and the number of other undergraduate enrolments decreased by 10.5% during this same five year period.
| 2014/15 | 2015/16 | 2016/17 | 2017/18 | 2018/19 | 2019/20 | |
|---|---|---|---|---|---|---|
| Postgraduate (Research) | 2,715 | 2,820 | 2,820 | 2,900 | 3,030 | 2,865 |
| Postgraduate (Taught) | 15,025 | 15,200 | 16,135 | 17,595 | 19,220 | 21,565 |
| First Degree | 125,175 | 128,345 | 131,105 | 133,550 | 135,300 | 136,375 |
| Other Undergraduate | 8,580 | 8,475 | 8,125 | 7,810 | 7,815 | 7,680 |
| Total | 151,495 | 154,845 | 158,180 | 161,855 | 165,360 | 168,485 |
Source: SG analysis of HESA student data.
Note: Figures have been rounded to the nearest 5.
Covid-19 impact on university enrolments
The HESA data on university enrolments presented above only shows data up to 2019/20, and therefore is not impacted by the Covid-19 pandemic. However, UCAS publishes data on Scottish domiciled placed applicants to Scottish providers 28 days after SQA results day, with data available up to 2021.
This data suggests that there was an increase in the under 25 year old Scottish domiciled placed applicants to Scottish providers, from 25,510 in 2019 to 26,470 in 2020 (up 3.8% over the year) and 28,170 in 2021 (up 6.3% over the year).
In particular, the number of under 17 year old placed applicants increased by 22.4% in between 2019 (490) and 2020 (600), and a further 1.7% between 2020 and 2021 to 610. Similarly, the number 18 year old placed applicants increased by 4.8% between 2019 (13,410) and 2020 (14,050) and a further 13.7% between 2020 and 2021, to 15,970. The number of 19 and 20 year olds saw more minor changes. The number of 21 to 24 year old placed applicants, on the other hand, increased by 5.8% between 2019 and 2020, however, the number fell again between 2020 and 2021 by 6%.
The considerable increase in placed university applicants aged 17 and 18 is consistent with the school leaver destinations data presented earlier in chapter 3, which saw an increase in the proportion of school leavers entering Higher Education for 2019/20 leavers.
There are several factors that may have influenced this increase in placed applicants, including fewer EU students applying and accepting university places; an increase in grades in 2020 and 2021, which means students are better-qualified for meeting course requirements and any offers they have received; and fewer job opportunities as a result of the pandemic which may have encouraged more young people to apply to university instead of entering the labour market.
| 2015 | 2016 | 2017 | 2018 | 2019 | 2020 | 2021 | |
|---|---|---|---|---|---|---|---|
| 17 and under | 380 | 430 | 480 | 500 | 490 | 600 | 610 |
| 18 | 13,770 | 13,950 | 13,990 | 13,980 | 13,410 | 14,050 | 15,970 |
| 19 | 3,660 | 3,880 | 3,950 | 4,190 | 4,030 | 3,950 | 4,110 |
| 20 | 2,550 | 2,600 | 2,690 | 2,650 | 2,400 | 2,410 | 2,330 |
| 21-24 | 4,890 | 5,140 | 5,220 | 5,350 | 5,180 | 5,480 | 5,150 |
| All under 25 | 25,260 | 25,980 | 26,330 | 26,670 | 25,510 | 26,470 | 28,170 |
Source: UCAS (2021), 'Statistical Releases – Daily Clearing Analysis 2021'
Figures have been rounded to the nearest 10. Totals may not match due to rounding.
University enrolments by equalities and SIMD for 16 to 24 year olds
The share of enrolments from the 20% most deprived areas increased in the five years up to 2019/20, from 9.9% to 11.7%. At the same time, the share of enrolments from the 20% least deprived areas fell from 32.6% in 2014/15 to 31.8% in 2019/20. Despite this slight fall, there continues to be a considerably larger share of university enrolments from the least deprived areas.
Female enrolments in this age group are higher than male enrolments – 58.4% compared to 41.5% in 2019/20. This gap has widened from 14.1 pp in 2014/15 to 16.9 pp in 2019/20.
There were 23,435 enrolments by those who declared a disability in 2019/20. The share of students with a declared disability rose by 4.1 pp in the years between 2014/15 and 2019/20, from 9.8% to 13.9%.
There were 12,135 UK domiciled enrolments[43] by those who are from an ethnic minority background in 2019/20. The proportion of enrolments who are from an ethnic minority has increased by 2.6 pp, from 7.3% in 2014/15 to 9.9% in 2019/20.
The proportion of enrolments by those who are care experienced increased by 0.5 pp between 2014/15 and 2019/20, from 0.2% to 0.7%. Similarly, the proportion of enrolments by those with no care experience increased considerably, by 47.0 pp during the same time period, from 23.6% to 70.5%. These increases are likely due to the improvements in reporting, as the proportion of those with an unknown status decreased by 47.5 pp between 2014/15 and 2019/20. If we exclude the unknown category from the calculations, we find that the proportion of enrolments by those who are care experienced stayed steady, at 0.7% between 2014/15 and 2017/18, increasing by 0.3 pp thereafter.[44]
| 2014/15 | 2015/16 | 2016/17 | 2017/18 | 2018/19 | 2019/20 | |
|---|---|---|---|---|---|---|
| SIMD | ||||||
| 20% most deprived | 9.9 | 10.1 | 10.2 | 10.9 | 11.3 | 11.7 |
| 20% least deprived | 32.6 | 32.2 | 31.9 | 32.2 | 31.9 | 31.8 |
| Sex | ||||||
| Female | 57.1 | 57.5 | 57.8 | 58.0 | 58.2 | 58.4 |
| Male | 42.9 | 42.4 | 42.1 | 41.9 | 41.7 | 41.5 |
| Disability | ||||||
| Declared Disability | 9.8 | 10.4 | 11.3 | 12.1 | 13.1 | 13.9 |
| No known disability | 90.2 | 89.6 | 88.7 | 87.9 | 86.9 | 86.1 |
| Ethnicity | ||||||
| Minority Ethnic | 7.3 | 7.7 | 8.2 | 8.6 | 9.4 | 9.9 |
| White | 92.7 | 92.3 | 91.8 | 91.4 | 90.6 | 90.1 |
| Care Experiencea | ||||||
| Care experienced | 0.2 | 0.4 | 0.4 | 0.5 | 0.6 | 0.7 |
| No care experience | 23.6 | 53.4 | 65.7 | 69.9 | 70.5 | 70.5 |
| Unknown | 76.3 | 46.3 | 33.9 | 29.6 | 28.9 | 28.8 |
Source: SG analysis of HESA student data.
aUnlike other proportions in this table, care experience proportions include those with an 'unknown' status.
STEM[45] participation in university by equalities for those aged 16 to 24
Of all university enrolments, 50.5% were in Science based subjects compared to 49.5% in non-Science based subjects in 2019/20
Looking at gender data, males were more likely to be enrolled in Science based subjects than females (58.7% compared to 43.7%). This was reverse for non-Science based subjects (42.2% compared to 56.3%).
Ethnicity data, shows us that those from a minority ethnic background were more likely to be in enrolled in Science based subjects than those who are white (58.5% compared to 49.3%).
Finally, those with a declared disability were slightly less likely to enrol in Science based subjects than those with no known disability – 46.9% compared 49.9%.
| Science based subjects | Non-Science based subjects | |
|---|---|---|
| Total | 49.5 | 50.5 |
| Sex | ||
| Female | 43.7 | 56.3 |
| Male | 58.7 | 42.2 |
| Disability | ||
| Declared Disability | 46.9 | 53.0 |
| No known disability | 49.9 | 50.1 |
| Ethnicity | ||
| Minority Ethnic | 58.5 | 41.4 |
| White | 49.3 | 50.7 |
Source: SG analysis of HESA Student data.
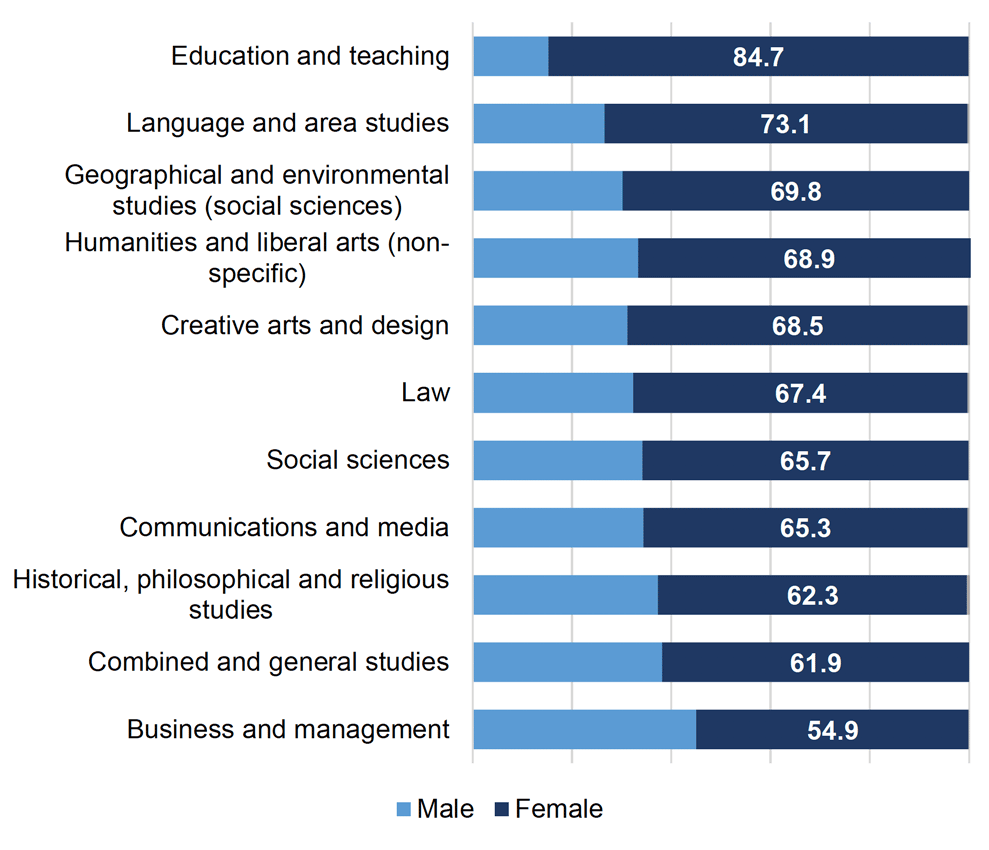
Gender balances in science and non-science based subjects at university for those aged 16 to 24
More females enrolled in every course type in non-science based subjects than males in 2019/20, though this varies from 54.9% female share in Business and management to 84.7% female share in Education and teaching, as shown in Chart 5.1.
Source: SG analysis of HESA student data.
This is different to Science based subjects, which can be divided into two in terms of gender balances. Subject relating to medicine, biology, geography and agriculture, many of which are not typically defined as STEM, were female dominated in 2019/20. The more traditional STEM subjects, such as engineering, computing, and mathematical sciences, on the other hand, were male dominated.
The largest gender imbalances in 2019/20 could be seen in Veterinary Science (86.1% female share), subjects allied to medicine (83.4% female share), Psychology (81.7% female share) Engineering & Technology (77.4% male share) and Computing (78.7% male share).

Source: SG analysis of HESA student data.
University leaver destinations for those aged 16 to 24 years?
Looking at known destinations data for university leavers 15 months after graduation, of all leavers aged 16 to 24 in 2018/19, the majority went into employment (65.2%). Breaking this down by level, those leaving a Postgraduate (Taught) degree were the most likely to go into employment (72.7%), followed by first degree leavers (64.7%). Of Postgraduate (Research) leavers, 39.1% went into employment.
Of all university leavers aged 16 to 24, 11.1% went to further study, and 11.0% to employment and further study. Postgraduate (Research) leavers were the most likely to enter further study (34.8%), followed by Other Undergraduates (17.5%). Only 6.5% of Postgraduate (Taught) and 11.7% of First Degree leavers went into further study.
Of all 2018/19 leavers aged 16 to 24, 5.8% were unemployed, with a further 0.6% waiting to start further study and 1.1% waiting to start work.
| Postgraduate (Research) | Postgraduate (Taught) | First Degree | Other Undergrad. | Total | |
|---|---|---|---|---|---|
| Employment | 39.1 | 72.7 | 64.7 | 46.0 | 65.2 |
| Further study | 34.8 | 6.5 | 11.7 | 17.5 | 11.1 |
| Employment and further study | 17.4 | 9.5 | 10.8 | 18.2 | 11.0 |
| Voluntary or unpaid work | 4.3 | 1.6 | 1.3 | 1.8 | 1.4 |
| Other including travel, caring for someone or retired | 4.3 | 3.3 | 3.6 | 7.7 | 3.8 |
| Due to start work | 0.0 | 1.2 | 1.0 | 0.7 | 1.1 |
| Due to start study | 0.0 | 0.1 | 0.6 | 2.8 | 0.6 |
| Unemployment | 4.3 | 4.8 | 6.1 | 5.3 | 5.8 |
Source: SG analysis of HESA Graduate Outcomes Survey 2018/19 data.
Note: Totals may not match due to rounding.
Contact
There is a problem
Thanks for your feedback