Partnership Action for Continuing Employment: client experience survey 2020
This report provides key findings on the influence of the Scottish Government's initiative for responding to redundancy situations, Partnership Action for Continuing Employment (PACE).
5. Post-Redundancy Outcomes and The Influence of Pace
Chapter summary
This chapter details the outcomes for PACE clients post their redundancy, in terms of wider benefits, overall satisfaction and employment outcomes. Below is a summary of findings from the chapter.
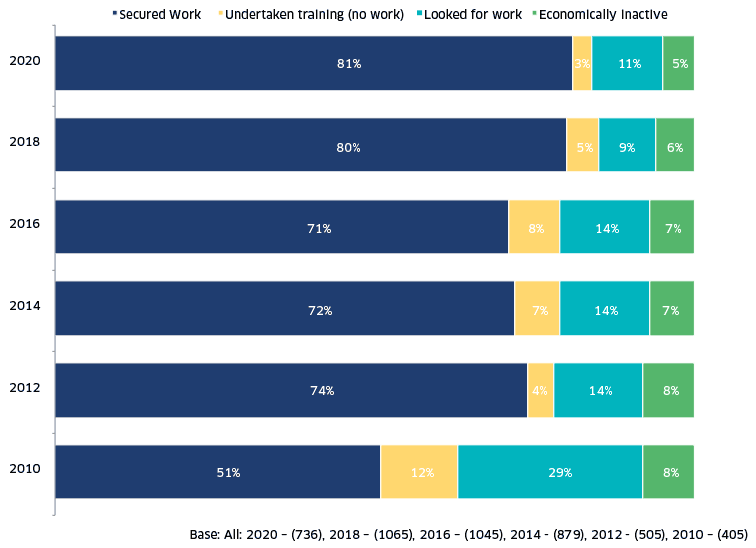
- The proportion of participants who have secured work at any point since their redundancy has remained stable since the increase in 2018: eight in ten had done so (81% compared to 80% in 2018, and 71% in 2016).
- Results varied by age and social grade: employment outcomes were significantly most positive for clients aged under 40 (90% had gone back into employment either before or after being made redundant), while those in socio-economic Grade D/E were less likely to have secured work either before or after being made redundant (68%).
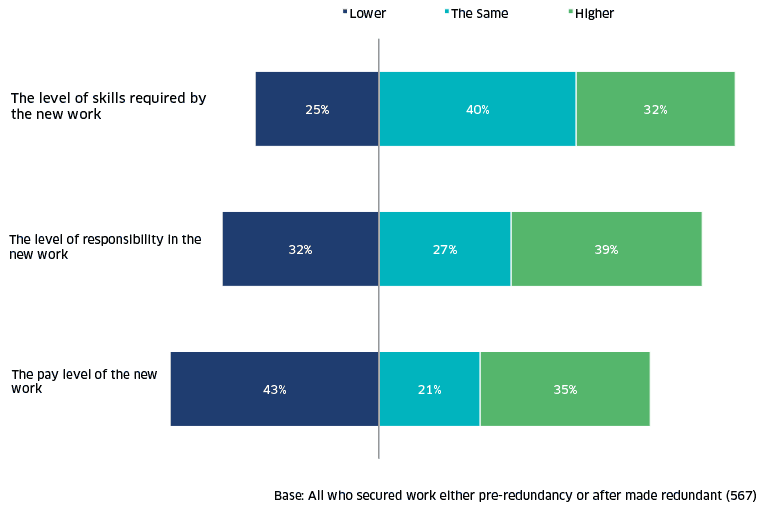
- Of those that had secured work, the majority had found work which required at least the same, or higher, level of skills (72%) and either the same or higher level of responsibility (66%). More than half (56%) had found work with at least the same level of pay. These proportions have increased compared to 2018.
- Around half of clients surveyed (47%) agreed that PACE helped them transition back into work, which is consistent with previous survey waves (46% in 2018 and 47% in 2016).
- PACE continues to positively impact clients in a range of different ways including practical job search skills as well as their confidence and motivations. Around half agreed that PACE had increased their ability to write CV/job applications (54%), receptiveness to seeking alternative employment (51%) and confidence in applying for jobs (49%).
- In line with these positive findings, overall satisfaction amongst PACE clients was high at 82%, significantly increasing from 2018. This increase may be in part influenced by the greater proportion of younger respondents as they were more likely to have better job outcomes compared to older clients.
5.1 This chapter looks at the current employment situation of PACE clients and what influence they felt accessing the PACE service has had on their employment outcomes. They were also asked about the wider benefits they gained from PACE and their overall satisfaction with the experience. These clients received PACE services from January 2018 to January 2020 and were asked about their work status in the new client survey in January and February 2020.
Post-redundancy work outcomes
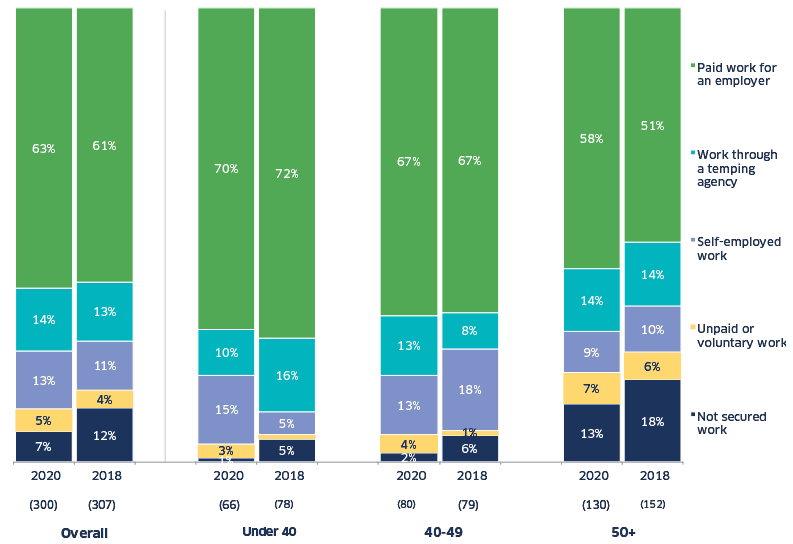
5.2 Overall outcomes from PACE continue to be very positive: four-fifths of clients (81%) had entered employment before or after their redundancy, (consistent with 2018 result of 80%, but significantly higher than the 71% recorded in 2016).
5.3 Results varied by age: employment outcomes were significantly most positive for clients aged under 40 (90% had gone back into employment either before or after being made redundant, reducing to 74% for those aged 50+ years).
5.4 Those in socio-economic Grade D/E were less likely to have secured work either before or after being made redundant (68% compared to 92% of Grade C2 and 87% of Grade C1). Figure 5.1 shows the proportion of PACE clients who secured work either before or after leaving their role selected for redundancy, by age and social economic grade.
5.5 Of those that had secured work post-redundancy, the majority (91%) had done so within six months (73% within three months and 18% in three to six months); this is a significantly higher proportion than 2018 where 82% had found work within six months.
5.6 Figure 5.2 outlines the post-redundancy outcomes of clients across the six waves of the research. The figure presents the proportion of clients who have secured work at some point following redundancy, the proportion that have not secured work since their redundancy but have undertaken training, as well as those that have not secured work but are currently looking for work. The remaining clients were not seeking work at the time of interview and are here classified as ‘economically inactive’.[10]
5.7 Overall, the proportion who have secured work at some point since being made redundant has remained consistent with 2018, as have the proportions in education or training, looking for work and those who are economically inactive.
5.8 Clients also reported on the type of work they had found post-redundancy. Of those in employment, the majority (83%) were working full-time and 16% were working part-time. This is in line with 2018 results, where 81% had found full-time employment and 18% were in part-time employment.
5.9 Those aged over 50 were less likely to find full-time employment (75% compared to 87% of those aged under 40).
5.10 Compared to 2018, a greater proportion of those in employment were in permanent positions (this had increased from 73% in 2018 to 78% in 2020). Twelve % were in contracted positions (six % contracted for greater than or equal to 12 months, and six % for less than 12 months), and nine % were in casual positions with no fixed terms of employment.
Characteristics of post-redundancy employment
5.11 Figure 5.3 looks at the job characteristics of clients’ post-redundancy roles.
5.12 In terms of the level of skills required in their post-redundancy role, the majority of clients (72%) had secured work with at least the same level of skill requirements, including a third (32%) that had secured work requiring a higher level of skills. This represents an increase from the 2018 figure for higher level skills (25%).
5.13 Two-thirds (66%) of clients indicated that the level of responsibility in their subsequent job was at least the same as required by the role they were made redundant from. Nearly two-fifths (39%) had secured work with a higher level of responsibility which, again, is an improvement from 32% in 2018.
5.14 In terms of pay, whilst 43% had taken a pay cut in order to get back into employment, more than half (56%) had found work with at least the same level of pay. Over a third (35%) had found work with a higher level of pay, an increase from 2018, when only just over a quarter (27%) had found a role with a higher level of pay.
5.15 Employment outcomes varied by age: younger respondents were significantly more likely to have secured work requiring a higher level of skills (44% for those aged under 40, compared to 17% for those aged over 50), responsibility (54% for those under 40, compared to 23% for those aged over 50), or with a higher level of pay (53% for those under 40 compared to 18% among clients aged over 50s).
5.16 There were also notable differences by gender this year, with males being significantly more likely than females to secure jobs with higher levels of skills (37% of males compared to 24% of females), responsibility (44% of males compared to 31% of females) and pay (39% of males compared to 30% of females).
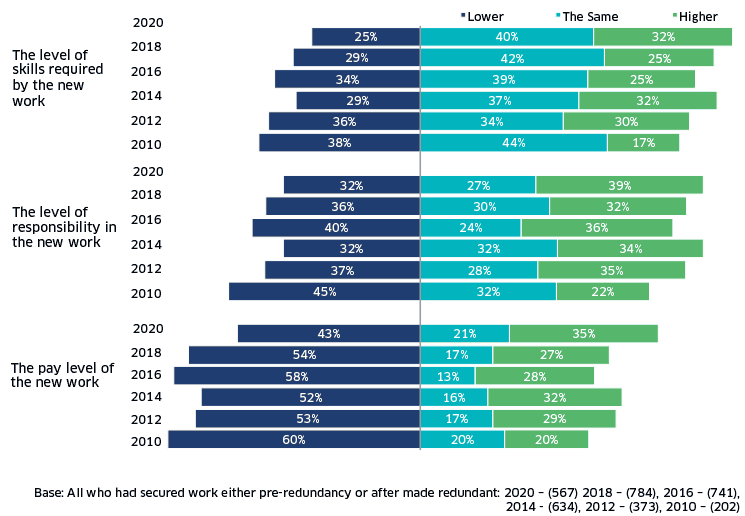
5.17 Figure 5.4 highlights how 2020 findings compare with the previous waves of the research. As detailed above, findings for the current survey are generally more positive – this is being driven in part by the younger age profile of the sample. It may also relate to the reduced number of clients who worked in the oil and gas industry in the 2020 survey (this group tend to find it harder to secure work with comparable terms and conditions post-redundancy).
The influence of PACE services on the move back to work
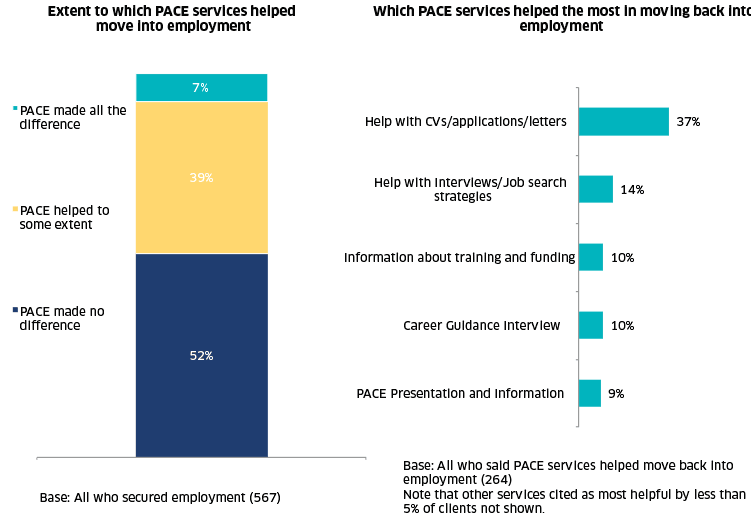
5.18 Clients who had entered employment were asked what influence, if any, PACE services had on this transition. The perceived influence of PACE services on securing work is shown in Figure 5.5. Almost half (46%) of those who have entered employment believed PACE services had some influence, including seven % reporting that PACE had made all the difference. These results are broadly in line with the 2018 and 2016 findings (46% and 47% respectively).
5.19 Those who said PACE services contributed, at least in part, to them returning to employment were subsequently asked which services helped the most with this. As in previous years the five key services remained consistent, though of these some services had seen significant reductions in influence: help with CVs/applications/letters (37%), help with interviews/job search strategies (14%), information about training and funding (ten %, a significant decrease from 17% in 2018), career guidance interview (ten %), and PACE presentation and interview (nine %, a decrease from 16% in 2018).
5.20 The PACE services accessed also influenced the extent to which clients perceived PACE services to have helped them back into employment. Clients who only received the PACE presentation and information pack were significantly less likely to feel PACE had helped them in getting back into work (six % felt it had done so, either to some extent or that it had made all the difference) – compared to those who had accessed other services in addition to the PACE presentation (51%), or those who received other services but not the presentation (43%). This suggests that the presentation plays an important introductory role but should be complemented with other services if possible.
Engagement with learning, training and development post-redundancy
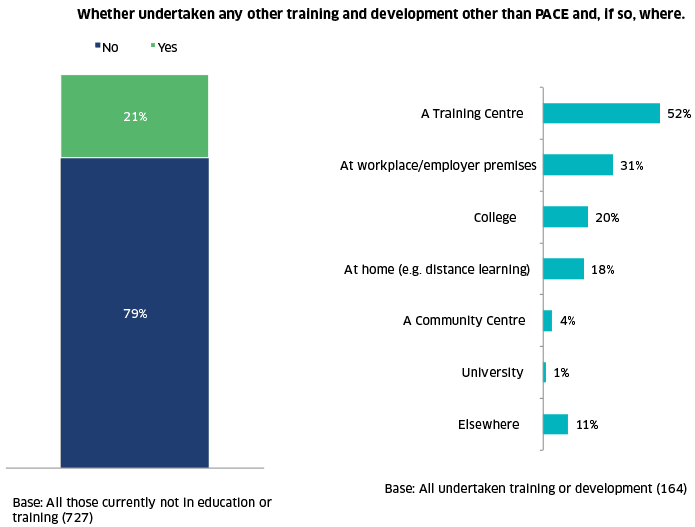
5.21 Clients were asked about whether they had taken up any training and development since leaving their last position (independent of whether they were working or not). Responses are summarised in Figure 5.6. A fifth (21%) of clients had undertaken training and development, a small but significant fall in comparison to 2018 (27%), but in line with the 2016 figure of 23%.
5.22 Younger clients were more likely to have undertaken training. Just 17% of clients aged over 50 had undertaken training, 25% of those aged under 40 and 26% of those aged 40 to 49 had done so. This pattern was also seen in relation to qualification level, where those with higher existing qualifications were more likely to undertake training. Over a quarter (28%) of those with a qualification above degree level had done some post-PACE training, compared to 9% of those with a qualification between Scottish Standard/O grades.
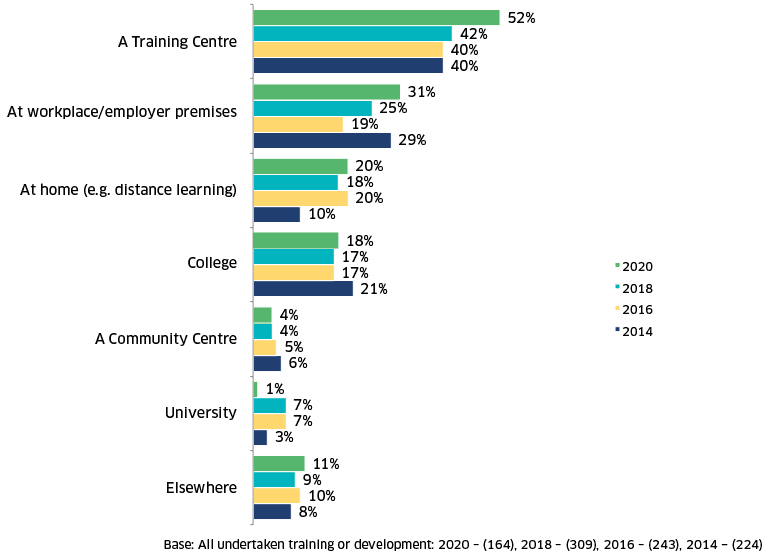
5.23 Clients who had undertaken training or development were asked where this had taken place (see also Figure 5.7). Clients most commonly completed further training at a training centre (49%) or at a workplace/employer premises (31%). Only one % had gone onto further training at a university; this is significantly lower than 2018 and 2016 (seven % at both iterations).
5.24 PACE had some influence on clients’ decisions to enter training, with 26% of those who had undertaken training and development other than PACE saying that PACE services had at least some influence on them moving into training or education, and seven % saying it made all the difference. These findings are in line with those from 2018.
The influence of PACE on client motivation and confidence
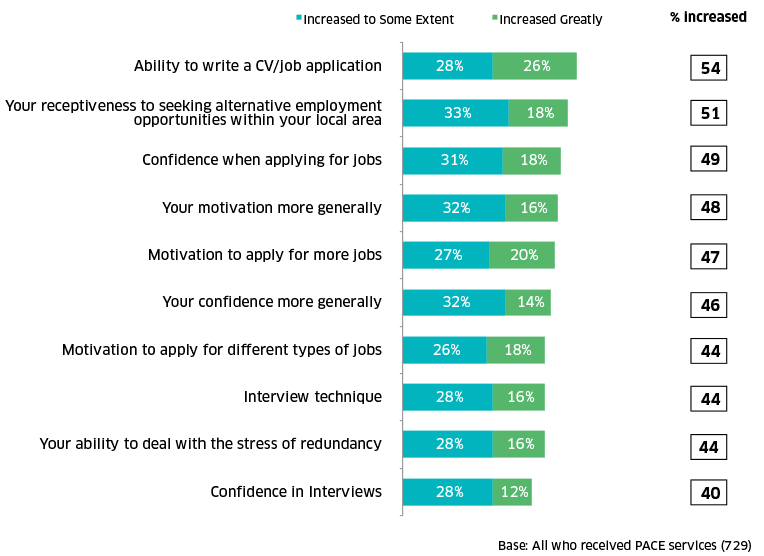
5.25 Clients were asked to rate the influence of PACE on their skills, motivation and confidence when looking for work. Their responses are outlined in Figure 5.8, and results are uniformly more positive than those recorded in 2018.
5.26 The PACE support services most likely to influence clients’ motivation and confidence were: ability to write a CV/ job application (54%, increased from 45% in 2018); their receptiveness to seeking alternative employment opportunities within the local area (51%, up from 47% in 2018); their confidence when applying for jobs (49% increased from 39%); their motivation to apply for more jobs (47%; increased from 2018 at 39%); and their motivation more generally (48% increased from 40% in 2018).
5.27 The aspect least likely to be influenced by PACE support services was clients’ confidence in interviews (40% reported that this had increased greatly or to some extent), though the figure was still eight %age points higher than that of 32% reported in 2018.
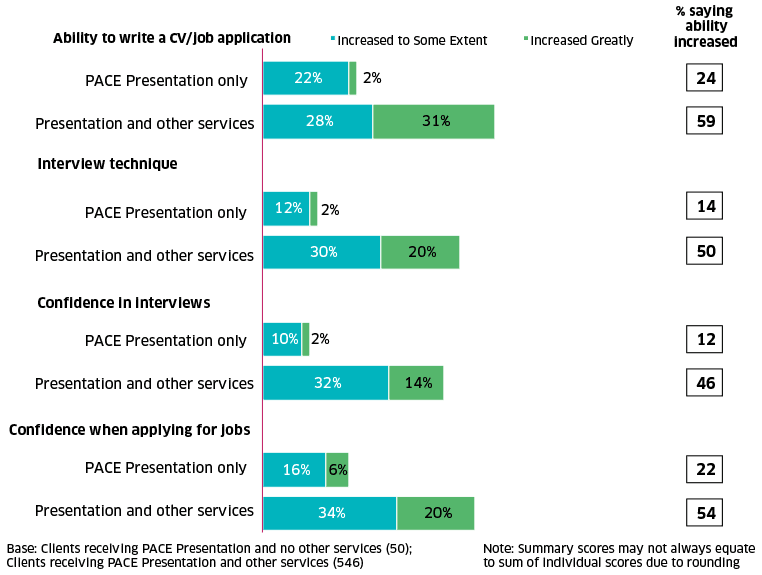
5.28 Across a range of services, younger clients were more likely to report greater shifts in confidence and motivation compared to older clients. In line with previous findings, it was evident that accessing services beyond the PACE presentation and guide meant clients were more likely to feel that the service had improved their skills.
5.29 Figure 5.9 compares the proportions who said that PACE led to an improvement across a number of key job search outcomes between those that only received the basic presentation and guide and those who accessed at least one additional service. Differences are marked.
5.30 While a quarter (25%) of those who had attended the initial PACE presentation only felt their ability to write a CV or job application had increased, over half (59%) of respondents who had received other additional services saw an improvement in this area. Similarly, while 14% of those receiving the PACE presentation only reported an improvement in their interview technique, half (50%) of those who had accessed more PACE services were able to identify an increase. The same trends can be seen when looking at confidence in interviews and confidence when applying for jobs.
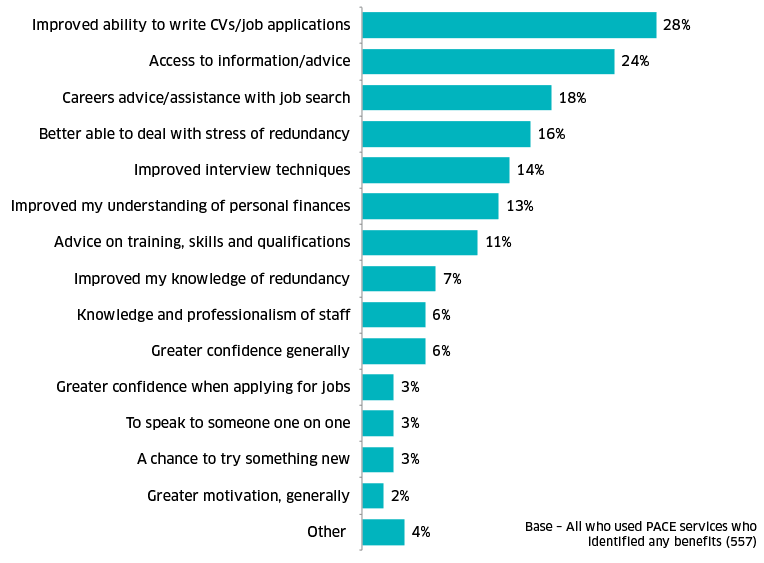
Perceived benefits of PACE
5.31 Clients were asked to give their opinion on what had been the main benefits of accessing the PACE service in an unprompted question. Responses are summarised in Figure 5.10.

5.32 Clients were also asked to comment whether they felt there were any gaps in PACE provision or any services which could be improved upon. While 21% felt that there had been nothing missing, others noted a range of elements they felt could be improved. More personalised one-to-one help (eight %), more information or support materials, more follow-up help, or help that arrived earlier in the redundancy process (all six %), were the most commonly referenced areas that could be improved.
Satisfaction with the overall experience of PACE
5.33 As shown in Figure 5.11, overall satisfaction with PACE is high; 83% of clients reported that they were satisfied with their overall experience of PACE. This figure is an increase from previous surveys (76% in 2018 and 75% in both 2016 and 2015).
5.34 The 2020 overall satisfaction score is more in line with the average satisfaction with PACE services that is reported in Chapter 4 (86%). It is likely that when reporting overall satisfaction that clients are considering the subsequent job they achieved (if any). It may be that a client was not satisfied with the overall PACE experience if it did not lead to a job at the end of it, but could still be satisfied with the delivery of the individual PACE services.
5.35 This is supported by the finding that those clients who had secured work post-redundancy were more likely to express overall satisfaction compared to those who had not found work (83% vs. 76%). We also see that older clients (who are less likely to have found work) were less likely to be satisfied with the PACE service overall, with one-fifth saying they were dissatisfied compared to 12% of those aged under 40. This finding by age also helps to explain why overall satisfaction has increased for 2020 which featured a larger number of younger clients.
5.36 In line with previous findings, those who only received the PACE presentation were less likely to be satisfied with the service (24% were not at all satisfied compared to only five % of those who had received the presentation and other services), and far less likely to be very satisfied compared with those who received additional services (16% of those who only received the PACE presentation were very satisfied compared to 52% of those who had received other services as well as the presentation).
5.37 Overall, nearly three-quarters (72%) of clients felt that the support they had received through PACE had met or exceeded their expectations: a quarter (24%) felt it had exceeded their expectations of redundancy services, while half (48%) felt their expectations had been matched. Older clients were more likely to feel PACE did not meet their expectations of a redundancy support service (24% of clients aged 50+, compared to 13% of clients under 40). Again, job outcomes appear to have a strong influence on the extent to which expectations were met as those who had re-entered employment were more likely to say the experience either exceeded or matched their expectations (75%) compared to those who had not (62%).
5.38 Nearly nine in ten (87%) clients said that they were likely to recommend PACE services to others (higher than the 2018 figure of 80%) and this rises to 92% among those aged under 40 years. Those who only received the PACE presentation were significantly less likely to recommend PACE compared to those who accessed a wider range of services, again reiterating the positive implications of the findings this year showing an increase in clients making use of a greater number of services.
Contact
Email: margaret.sutor@gov.scot
There is a problem
Thanks for your feedback