Scottish household survey 2018: annual report
Results from the 2018 edition of the continuous survey based on a sample of the general population in private residences in Scotland.
13 Childcare
Main Findings
Questions on childcare were included in Scottish Household Survey for the first time in 2018. Therefore, yearly comparisons are not available for this report.
Types of childcare
Overall, 80 per cent of households with a two- to five-year-old used some form of childcare.
A total of 43 per cent of households in Scotland with a child aged between two and five years old used a local authority nursery for childcare. Households with two year olds were more likely to use private nurseries or a relative or friend for childcare than any other type of childcare. Use of local authority childcare increased as area deprivation increased.
Small families were more likely to use private nurseries[143] (28 per cent) compared with large families (12 per cent) and single parent families (18 per cent).
Hours of Childcare used
Of the households who used childcare, almost half (45 per cent) used between 11 and 20 hours per week during term-time. A further 23 per cent used between 21 and 30 hours of childcare, and 12 per cent used more than 30 hours.
The majority (63 per cent) of families stated that the main reason they used childcare was so that they could work.
Use of funded childcare
Around half of parents/carers with three and four year olds used between 11 and 20 hours of funded childcare compared with only six per cent of parents/carers with two year olds. The percentage using funded childcare was a lot lower for two year olds as only some children of this age are entitled to funded provision.
Childcare costs and affordability
More than half of households (52 per cent) either did not pay for childcare during school term-time or all childcare used was funded by the local authority or Scottish
Government. The proportion of households who paid for childcare increased as area deprivation levels decreased. The majority of households (72 per cent) said that they did not find it difficult to afford childcare. However, 17 per cent of households said they find it was difficult to afford childcare and 11 per cent stated it was very difficult.
13.1 Introduction and Context
The Scottish Government’s ambition is that every child in Scotland is able to realise their full potential. Giving every child the best start in life is central to this commitment, and investment in early learning and childcare (ELC) is one way in which the Scottish Government is working towards making Scotland the best place in the world to grow up.
The Scottish Government and local authorities have committed to almost doubling the funded ELC entitlement from 600 to 1,140 hours per year for all three and four year olds[144], and eligible two year olds[145] from August 2020[146]. This expansion follows a number of smaller expansions in the past decade. Families will be able to access their funded ELC entitlement through local authority settings as well as providers in the private and third sector, including childminders[147]. This expansion will extend the entitlement to the equivalent of 30 hours a week over a 38-week term.
The ELC expansion aims to deliver three benefits for children and families:
- Children’s development improves and the poverty-related attainment gap narrows
- More parents will have the opportunity to be in work, training or study
- Increased family resilience through improved health and wellbeing of parents and children.
The expansion of funded ELC is underpinned by four guiding principles:
- Quality – the expansion will ensure a high quality ELC experience for all children
- Flexibility – the expansion will support more parents and carers into work, training or study, through a greater choice of provider and patterns of provision
- Accessibility – the expansion will ensure that ELC provision is sufficient and is as conveniently geographically located as possible, particularly in areas of higher deprivation and in rural communities
- Affordability – the expansion will increase access to affordable ELC which will help to reduce barriers to participating in the labour market.
Local authorities are responsible for the implementation and delivery of funded ELC to their local communities. They have flexibility to determine the most appropriate way to phase in the expanded entitlement in their local area as they build capacity. This means that many children have already started receiving between 600 and 1,140 hours of funded ELC.
The Scottish Government collects a wide range of data on ELC. The ELC Census monitors the provision of funded ELC, collecting data on the number of centres, staff and registrations. The Scottish Study of ELC (SSELC) will assess the impact of the ELC expansion on child, parent and family outcomes[148]. The Scottish Household Survey (SHS) is another source of evidence on experiences of households accessing childcare that can be used to understand the use and impact of ELC in Scotland.
Within the context of the ELC expansion, questions on ELC, and childcare more broadly, were included in the SHS for the first time in 2018[149]. The first section of this chapter outlines the variations in the type of childcare (both formal and informal) and number of hours used. The next sections look at funded ELC in particular, outlining households’ use and views of funded ELC. The final section details costs of and views on the affordability of childcare.
The data presented in this chapter focuses on households with a child aged between two and five years old (who has not yet started school). If a household had more than one child that fits these criteria, a child was chosen at random within this age range. All questions were then answered in response to the childcare this child received. Some questions on childcare were asked of a further group of households with a child aged 11 and under but analysis on this data is not included in this chapter[150].
13.2 Use of Childcare
The Scottish Household Survey provides information on the different types and the number of hours of childcare used in school term-time and during school holidays; and also covers information on the main reasons parents/carers choose to use childcare.
13.2.1 Type of Childcare
The different types of childcare parents/carers use are:
- Local authority nursery or pre-school[151]
- Private nursery or pre-school
- Childminder
- Play group
- Family centre
- A relative or friend.
Among the different childcare options available, some parents/carers choose to use one or a mix of two or more of the types of childcare mentioned above. Some parents did not use any kind of childcare.
Figure 13.1 shows that the type of childcare used by the majority of parents who have children aged three or four years old (or five years old not yet at school) is local authority nurseries. Just over half (52 per cent) of three year olds and 62 per cent of children aged four and above used local authority nursery provision. Only 13 per cent of two year olds used this type of childcare. The difference by age is likely to be due to the eligibility criteria for accessing funded Early Learning and Childcare (ELC). The statutory entitlement to funded ELC begins the term after a child’s third birthday, although some two year olds are also entitled to funded ELC[152].
For households with a two year old, the most common types of childcare used were private nurseries or being taken care of by a relative or friend, both at 27 per cent. The proportion of parents using a relative or friend for childcare was similar for all age groups.
A total of 19 per cent of households with a child aged between two and five years old (who has not yet started school) did not use any type of childcare. Households with two year olds were more likely than households with older children to not use any childcare: 31 per cent compared with 14 per cent and 12 per cent respectively.
Figure 13.1: Type of childcare used by age of the child[153]
Percentages, 2018 data (minimum base: 210)
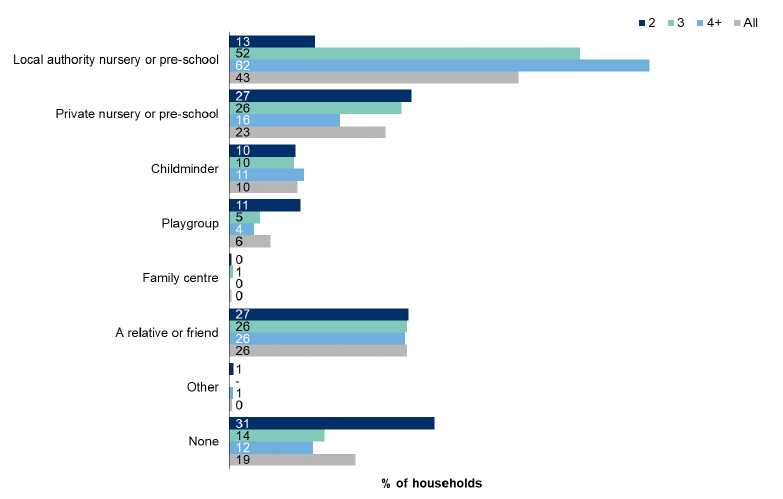
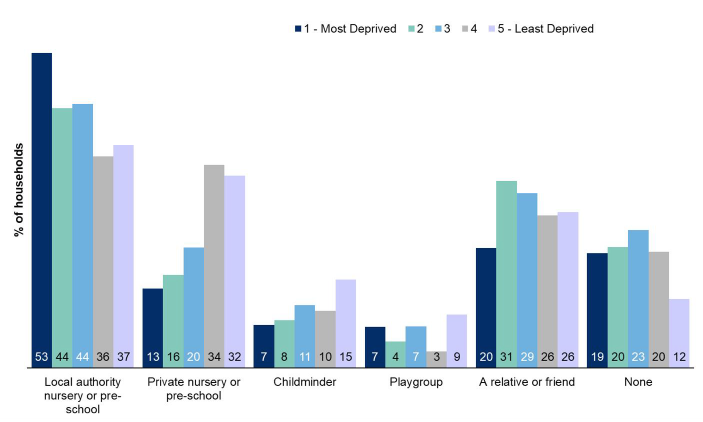
Figure 13.2 shows the type of childcare used according to the level of deprivation experienced by respondents (using Scottish Index of Multiple Deprivation (SIMD 2016)). The use of local authority nursery provision increased with area deprivation. Over half (53 per cent) of households in the 20 per cent most deprived areas used local authority nurseries compared with 37 per cent in the 20 per cent least deprived areas. In contrast, the use of private nurseries generally increased as area deprivation of the household decreased, with 32 per cent of the least deprived households using this type of provision compared with 13 per cent from the most deprived areas.
Figure 13.2: Type of childcare used by Scottish Index of Multiple Deprivation 2016 quintiles[154]
Percentages, 2018 data (minimum base: 130)
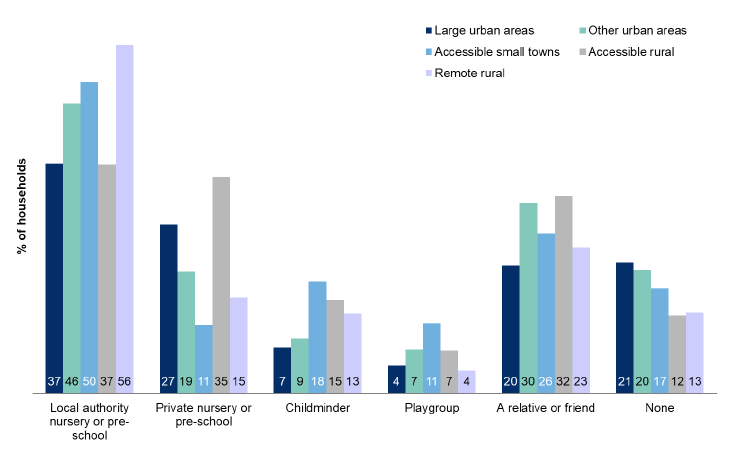
When it comes to urban and rural areas (Figure 13.3), the highest use of a local authority nursery was in remote rural areas, with over half (56 per cent) accessing this type of childcare. The second most commonly used type of childcare for households living in these areas was a relative or a friend at 23 per cent. The use of local authority nurseries was greater in rural areas compared with urban areas, with the exception of accessible rural areas. In accessible rural areas, the use of local authority or private nurseries was similar, at 37 and 35 per cent respectively.
Figure 13.3: Type of childcare used by urban rural classification[155]
Percentages, 2018 data (minimum base: 60)
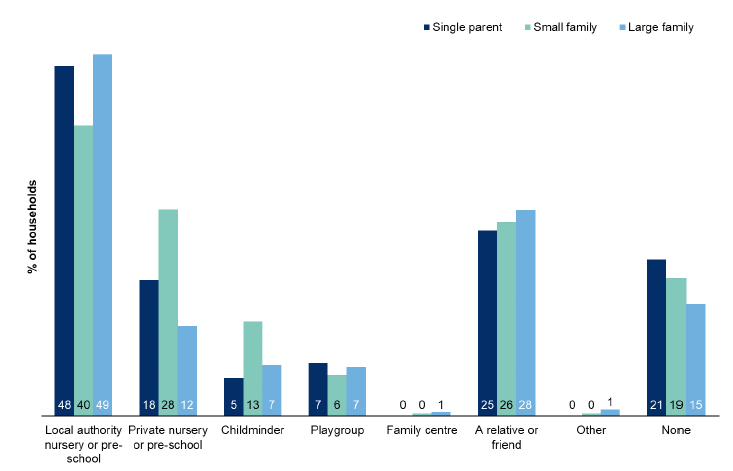
The use of local authority nurseries was similar for all household types[156] and ranged from 40 per cent (small families) to 49 per cent (large families) (Figure 13.4). Twenty-eight per cent of small families used private nurseries, more than double compared with large families (12 per cent) and 10 percentage points more than single parent families (18 per cent). Small families were around twice as likely to use childminders as single parents (13 per cent and five per cent respectively). Very few households used playgroups (six per cent) or family centres (less than one per cent).
Figure 13.4: Type of childcare used by household type
Percentages, 2018 data (minimum base: 140)
13.2.2 Hours of childcare used per week
The data presented below show the number of hours of childcare used by the families that used one or more of the types of childcare mentioned in section 13.2.1.
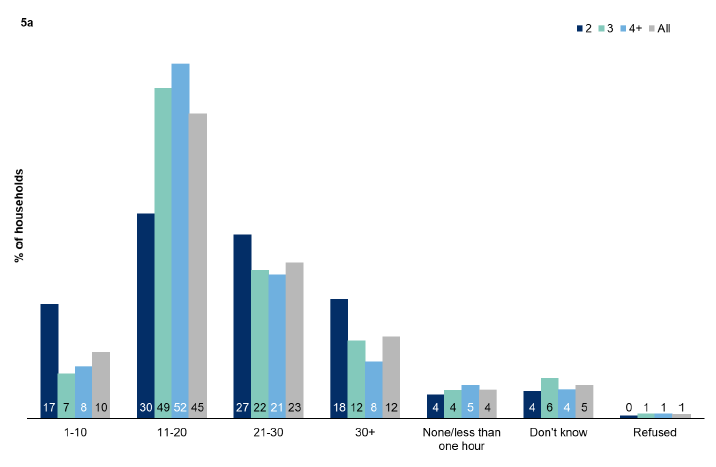
Just under half (45 per cent) of households used between 11 and 20 hours of childcare per week during term-time (Figure 13.5a). A further 23 per cent used between 21 and 30 hours of childcare, and 12 per cent of households used more than 30 hours of childcare per week during term-time.
The majority of households with three and four year olds and above used 11 to 20 hours of childcare during term-time (Figure 13.5a). This is in line with the current entitlement of around 16 hours of funded ELC per week during term-time. Over 30 hours of childcare was more likely to be used by households with two year olds (18 per cent) than households with four year olds and above (eight per cent).
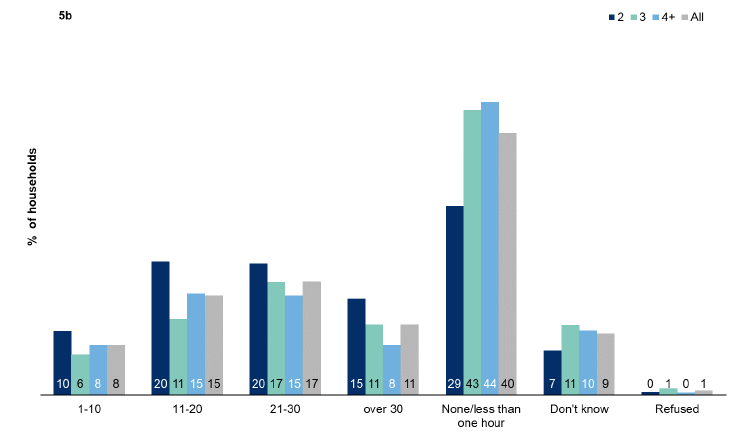
During school holidays, two fifths of families did not use childcare (40 per cent) and the hours of childcare that families did use was similar among all age groups (Figure 13.5b).
Figure 13.5: Hours of childcare used per week during school term-time (5a) and during school holidays (5b) by age (asked to families that use some type of childcare)[157][158]
Percentages, 2018 data (minimum base: 150)
Area deprivation had little effect on the hours of childcare used during term-time (Table 13.1a). Although there appear to be large differences in percentages between deprivation quintiles, small base sizes mean that estimates can have relatively large degrees of uncertainty around them and therefore this data should be interpreted with caution.
During school holidays a large proportion of households responded that they either do not use any childcare or use less than an hour of childcare per week (Table 13.1b). The number of hours of childcare used during school holidays was variable across different deprivation areas.
Table 13.1: Hours of childcare used per week during school term-time (1a) and school holidays (1b) by SIMD quintiles[159]
Percentage of households, 2018 data
| 13.1a Hours during term-time |
1 - Most Deprived | 2 | 3 | 4 | 5 - Least Deprived | All |
|---|---|---|---|---|---|---|
| 1-10 | 11 | 5 | 10 | 7 | 14 | 10 |
| 11-20 | 46 | 51 | 49 | 48 | 33 | 45 |
| 21-30 | 22 | 18 | 19 | 21 | 34 | 23 |
| over 30 | 9 | 11 | 6 | 21 | 14 | 12 |
| None/less than one hour | 6 | 6 | 6 | 1 | 3 | 4 |
| Don't know | 5 | 8 | 8 | 2 | 2 | 5 |
| Refused | 1 | 1 | 1 | - | - | 1 |
| All | 100 | 100 | 100 | 100 | 100 | 100 |
| Base | 120 | 100 | 110 | 110 | 130 | 580 |
| 13.1b Hours during school holidays |
1 - Most Deprived | 2 | 3 | 4 | 5 - Least Deprived | All |
|---|---|---|---|---|---|---|
| 1-10 | 7 | 9 | 7 | 6 | 8 | 8 |
| 11-20 | 7 | 19 | 19 | 21 | 12 | 15 |
| 21-30 | 19 | 11 | 13 | 15 | 25 | 17 |
| over 30 | 8 | 10 | 9 | 15 | 12 | 11 |
| None/less than one hour | 48 | 38 | 39 | 37 | 36 | 40 |
| Don't know | 10 | 13 | 13 | 6 | 6 | 9 |
| Refused | 2 | 1 | - | - | 0 | 1 |
| All | 100 | 100 | 100 | 100 | 100 | 100 |
| Base | 120 | 100 | 110 | 110 | 130 | 580 |
13.2.3 Main reason for using childcare by Scottish Index of Multiple deprivation (SIMD) quintiles
The most commonly reported reason for using childcare (Table 13.2) was so that parents/carers can work (63 per cent). The proportion of households reporting this as a reason increased as area deprivation decreased, from 46 per cent of households in the most deprived areas to 77 per cent of households in the least deprived areas. A similar pattern can be seen for households who used childcare for their child’s social development (including mixing with other children), where there was a 13 percentage point difference between households in the most and least deprived areas (21 per cent and 34 per cent respectively). The pattern for parents reporting that they used childcare to help their child prepare for school, or for their child’s learning and language development does not follow this trend.
Table 13.2: Main reason for using childcare by SIMD quintile[160]
Percentage of households, 2018 data
| Reasons | 1 - Most Deprived | 2 | 3 | 4 | 5 - Least Deprived | All |
|---|---|---|---|---|---|---|
| So that I (or my partner) can work | 46 | 59 | 60 | 69 | 77 | 63 |
| For my child’s social development (including mixing with other children) | 21 | 25 | 24 | 32 | 34 | 27 |
| To help prepare my child for school | 30 | 27 | 26 | 23 | 20 | 25 |
| For my child’s learning and language development | 24 | 20 | 18 | 25 | 17 | 21 |
| To give my child the opportunity to try new activities and experiences | 13 | 16 | 24 | 21 | 11 | 17 |
| Because my child likes spending time there | 11 | 8 | 3 | 9 | 14 | 9 |
| So that I (or my partner) can look for work | 1 | 6 | 6 | 3 | 7 | 5 |
| To give my child the opportunity to use different toys, books and outdoor equipment | 5 | 3 | 7 | 4 | 2 | 4 |
| So that I (or my partner) can socialise, exercise, spend time on hobbies, etc. | 4 | 4 | 1 | 6 | 5 | 4 |
| To give me (or my partner) some time to rest/destress/relax | 7 | 7 | 2 | 0 | 3 | 4 |
| So that I (or my partner) can study or improve work-related skills | 7 | 4 | 3 | 2 | 1 | 3 |
| To improve my child’s behaviour | 9 | 2 | 0 | 2 | 2 | 3 |
| So that I (or my partner) can look after other children | 6 | 3 | 2 | - | 1 | 2 |
| Other | 2 | 3 | 2 | 1 | 2 | 2 |
| So that I (or my partner) can look after the home (for example cooking,DIY, cleaning, etc.) | 2 | 4 | 1 | 2 | 1 | 2 |
| So that I (or my partner) can look after another relative or friend | - | - | 1 | 0 | 1 | 1 |
| Base | 120 | 100 | 110 | 110 | 130 | 580 |
Columns may not add to 100 per cent since multiple responses were allowed.
13.3 Use of funded ELC
All three and four year olds and some two year olds are entitled to Early Learning and Childcare (ELC) that is funded by the Scottish Government. Some children also receive ELC that is funded at the local authority’s discretion. Both types of funded ELC are combined and reported as funded ELC here. Please refer to the introduction for more information on the funded entitlement.
Information on the use of funded ELC during the school holidays is not included as the vast majority of people do not use funded ELC during school holidays.
13.3.1 Number of hours and days funded ELC used
For those who use funded ELC, this section will explore over how many days parents/carers use the funded hours and the number of hours of funded ELC used per week during term-time.
Table 13.3 shows that 53 per cent of parents/carers used funded ELC during term-time. Three per cent used between one and 10 hours, 39 per cent used between 11 and 20 hours, and another three per cent used between 21 and 30 hours. Around half (51 and 52 per cent) of parents/carers with children over three used 11 to 20 hours of funded ELC, compared with only six per cent of households with two year olds. This is likely to be because the current funded ELC entitlement is often offered as around 16 hours per week during term-time, although some children may receive their entitlement over the full year. Some children might also be entitled to more than this due to the phasing of the increase in funded hours through the ELC expansion[161], or due to local entitlements made available to some children. The percentage of households using funded childcare was a lot lower for two year olds as only some children of this age[162] are entitled to funded provision.
Table 13.3: Number of funded ELC hours used per week during school term-time by age[163]
Percentage of households, 2018 data
| Hours | 2 | 3 | 4+ | All |
|---|---|---|---|---|
| 1-10 | 2 | 3 | 2 | 3 |
| 11-20 | 6 | 51 | 52 | 39 |
| 21-30 | 2 | 2 | 6 | 3 |
| 30+ | - | 0 | - | 0 |
| None/my child is not entitled to any funded childcare | 80 | 21 | 23 | 37 |
| I don’t know if my child is eligible | 6 | 4 | 1 | 3 |
| My child uses funded childcare but I’m not sure how many hours | 2 | 11 | 8 | 8 |
| Refused | - | 1 | 1 | 1 |
| Don't know | 1 | 6 | 9 | 6 |
| All | 100 | 100 | 100 | 100 |
| Base | 150 | 230 | 200 | 580 |
Table 13.4 shows that the number of funded ELC hours used during term-time was similar across all levels of area deprivation.
Table 13.4: Number of funded ELC hours used per week during school term-time by SIMD[164]
Percentage of households, 2018 data
| Hours | 1 - Most Deprived | 2 | 3 | 4 | 5 - Least Deprived | All |
|---|---|---|---|---|---|---|
| 1-10 | 3 | 2 | 1 | 4 | 2 | 3 |
| 11-20 | 37 | 47 | 43 | 33 | 39 | 39 |
| 21-30 | 5 | 5 | 3 | 2 | 1 | 3 |
| 30+ | 1 | - | 0 | - | - | 0 |
| None/my child is not entitled to any funded childcare | 34 | 25 | 36 | 45 | 46 | 37 |
| I don’t know if my child is eligible | 4 | 7 | 2 | 1 | 2 | 3 |
| My child uses funded childcare but I’m not sure how many hours | 9 | 8 | 7 | 9 | 5 | 8 |
| Refused | 2 | - | 1 | - | 0 | 1 |
| Don't know | 6 | 6 | 6 | 5 | 5 | 6 |
| All | 100 | 100 | 100 | 100 | 100 | 100 |
| Base | 120 | 100 | 110 | 110 | 130 | 580 |
Of those that used funded ELC, 64 per cent of parents/carers spread their hours of funded ELC over five days during school term-time (Table 13.5).
Table 13.5: Number of days over which funded hours are used per week by those using funded ELC during school term-time
Percentage of households, 2018 data
| Days | All |
|---|---|
| 1 | - |
| 2 | 7 |
| 3 | 14 |
| 4 | 11 |
| 5 | 64 |
| 6 | - |
| 7 | - |
| Refused | - |
| Don't know | 4 |
| All | 100 |
| Base | 280 |
13.3.2 Reasons for not using funded ELC
Section 13.3.2 presents data showing the reasons families do not use funded ELC. Households who reported not using funded ELC in earlier questions were asked for the reasons why they did not use it. Excluded from this were households who reported earlier (13.3.1, Table 13.3) that they were not entitled to funded ELC. Table 13.6 shows that the largest group (43 per cent) responded that they were not eligible. Another group (15 per cent of households) reported that they did not know if their child was eligible and three per cent of families said they were not aware of the availability of funded childcare. This indicates that there was confusion amongst respondents when initially asked whether they were entitled to funded childcare; those not eligible should have reported this when asked about the number of hours of funded ELC used (Section 13.3.1).
Eight per cent of households said they would rather look after their child themselves and the same percentage of families felt their child was too young. Additionally, five per cent said that their child does not get a place in funded ELC until later in the year.
As a result of some non-eligible households being included in the base for this question, the percentages reported are likely to be underestimates, and this should be taken into account when interpreting these figures.
Table 13.6: Reasons for not using funded ELC
Percentage of households, 2018 data
| Reasons | All |
|---|---|
| Not eligible | 43 |
| I don’t know if my child is eligible | 15 |
| No reason/Don't know | 14 |
| He/she is too young | 8 |
| Rather look after him/her myself | 8 |
| Other | 7 |
| He/she does not get a place until later in the year | 5 |
| He/she is better cared for in a home environment | 4 |
| I was not aware of the availability of funded childcare | 3 |
| Don’t know how to apply/find applying too difficult | 2 |
| Lack of flexibility/choice in types of childcare available | 1 |
| None I could trust to provide a high quality service | 1 |
| The travel costs would be too high to get to a suitable provider | 1 |
| Lack of provision in school holidays | 1 |
| Lack of flexibility/choice in opening hours | 1 |
| Rarely need to be away from him/her | 0 |
| He/she wouldn’t like to be separated from myself (or my partner) | - |
| Travel time too long | - |
| Can’t afford it, even with funded hours, because always hidden costs | - |
| Doesn’t meet the additional support needs of my child | - |
| Base | 230 |
Columns may not add to 100 per cent since multiple responses were allowed.
13.4 Views on Funded ELC
Some families who use funded ELC have issues with some aspects of the provision. This section will present the responses of those who use funded hours, either during term-time or during school holidays, and their satisfaction with funded ELC and the issues they face.
13.4.1 Level of satisfaction with funded ELC
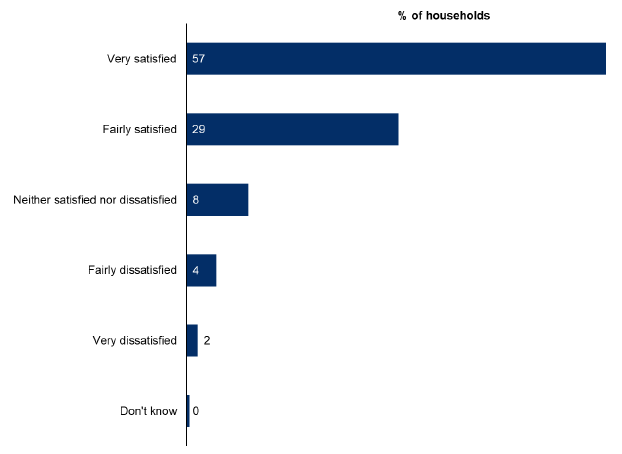
Figure 13.6 shows the level of satisfaction families had with the funded ELC they were receiving. Among the families who used funded hours, 86 per cent were either very satisfied or fairly satisfied with the overall quality of funded childcare and six per cent of families said they were not satisfied with the provision they were receiving.
Figure 13.6: Level of satisfaction with funded ELC
Percentages, 2018 data (base: 290)
Comparing the level of satisfaction by SIMD areas (Table 13.7), satisfaction was similar across all deprivation areas. Although satisfaction was slightly lower for the 20 per cent least deprived areas, the difference compared to other deprivation areas was not significant due to low base numbers.
Table 13.7: Level of satisfaction with funded ELC by SIMD
Percentage of households, 2018 data
| Level of Satisfaction | 1 - Most Deprived | 2 | 3 | 4 | 5 - Least Deprived | All |
|---|---|---|---|---|---|---|
| Very satisfied | 56 | 65 | 58 | 61 | 46 | 57 |
| Fairly satisfied | 33 | 27 | 29 | 21 | 32 | 29 |
| Neither satisfied nor dissatisfied | 6 | 2 | 10 | 5 | 17 | 8 |
| Fairly dissatisfied | 2 | 6 | 3 | 7 | 2 | 4 |
| Very dissatisfied | 2 | - | - | 5 | 1 | 2 |
| Don't know | - | - | - | - | 2 | 0 |
| All | 100 | 100 | 100 | 100 | 100 | 100 |
| Base | 60 | 60 | 60 | 50 | 60 | 290 |
13.4.2 Issues in using funded ELC
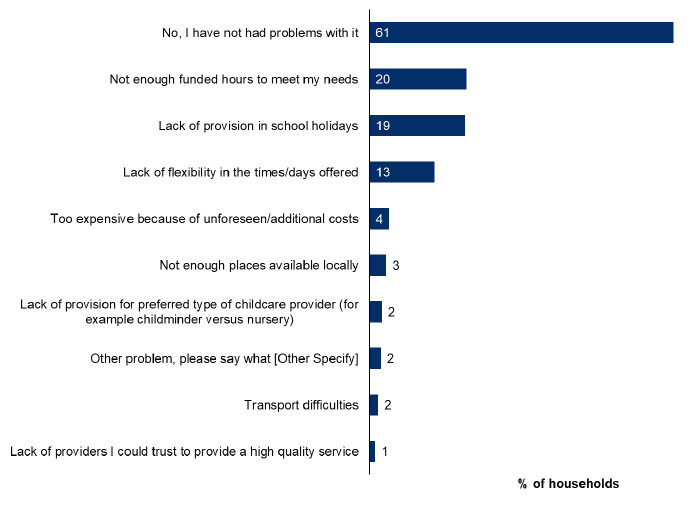
The majority of households (61 per cent) did not report any problems with the funded ELC they were receiving (Figure 13.7). However, some families reported issues with some aspects of funded provision. The most common issues families reported were: that there are not enough funded hours to meet their needs (20 per cent); the lack of provision during school holidays (19 per cent); and the lack of flexibility in the times or days offered (13 per cent).
Figure 13.7: Issues in using funded ELC
Percentages, 2018 data (base: 290)
In general, level of area deprivation had little impact on the issues being reported (Table 13.8). Although there appears to be a large difference between the most and least deprived areas for several issues, these are not significantly different due to low base numbers in these categories (See Annex 3 for more information). The exception to this was the reporting of ‘not enough funded hours to meet my needs’: families in the 20 per cent least deprived areas were more likely to report this issue than those in the 20 per cent most deprived areas (34 per cent and 14 per cent respectively).
Table 13.8: Issues in using funded ELC by SIMD
Percentage of households, 2018 data
| Issues | 1 - Most Deprived | 2 | 3 | 4 | 5 - Least Deprived | All |
|---|---|---|---|---|---|---|
| No, I have not had problems with it | 70 | 62 | 66 | 54 | 51 | 61 |
| Not enough funded hours to meet my needs | 14 | 19 | 10 | 19 | 34 | 20 |
| Lack of provision in school holidays | 14 | 13 | 25 | 28 | 18 | 19 |
| Lack of flexibility in the times/days offered | 10 | 7 | 10 | 12 | 25 | 13 |
| Too expensive because of unforeseen/additional costs | 3 | 5 | 0 | 9 | 3 | 4 |
| Not enough places available locally | - | 4 | 3 | 8 | 3 | 3 |
| Lack of provision for preferred type of childcare provider (for example childminder versus nursery) | 2 | - | 5 | 7 | - | 2 |
| Other problem, please say what [Other Specify] | 4 | - | 5 | - | 2 | 2 |
| Transport difficulties | 1 | 2 | - | 7 | - | 2 |
| Lack of providers I could trust to provide a high quality service | - | 1 | - | 5 | - | 1 |
| Base | 60 | 60 | 60 | 50 | 60 | 290 |
Columns may not add to 100 per cent since multiple responses were allowed.
13.4.3 Ways funded ELC providers are helping parents/carers support their children
There are many ways childcare providers support parents and carers with their child’s learning, such as by providing good ideas for childhood learning and development, and communication regarding their child’s progress to parents and carers of children receiving funded ELC.
Parents get help from the ELC providers by giving them ideas to support their child’s learning, such as outdoor activities, reading stories together, and sorting washing together. Table 13.9 shows that half (50 per cent) of households strongly agreed that they receive good ideas for learning and 31 per cent tended to agree. The level of agreement differed by area deprivation, where a total of 86 per cent of households from the most deprived areas agreed that the providers give them good ideas for ways to help their child learn compared to 65 per cent in the least deprived areas.
Table 13.9: Level of agreement of parents and carers with the statement ‘They give me good ideas for ways to help my child learn’ by SIMD
Percentage of households, 2018 data
| Level of Agreement | 1 - Most Deprived | 2 | 3 | 4 | 5 - Least Deprived | All |
|---|---|---|---|---|---|---|
| Strongly agree | 52 | 63 | 53 | 47 | 33 | 50 |
| Tend to agree | 34 | 25 | 29 | 33 | 32 | 31 |
| Neither agree nor disagree | 12 | 2 | 14 | 14 | 16 | 11 |
| Tend to disagree | 2 | 5 | 5 | 3 | 13 | 6 |
| Strongly disagree | - | 1 | - | 3 | 6 | 2 |
| Don't know | - | 4 | - | - | - | 1 |
| All | 100 | 100 | 100 | 100 | 100 | 100 |
| Base | 60 | 60 | 60 | 50 | 60 | 290 |
Table 13.10 shows how much parents and carers agreed that their funded ELC providers communicate with them regularly about their child’s progress. Sixty-four per cent of households strongly agreed that they are being informed regularly about the progress of their child. Level of agreement was lowest for those in the least deprived areas compared with those in all other deprivation areas; 76 per cent in the 20 per cent least deprived areas strongly or tended to agree whilst those from the other four deprivation areas were all above 90 per cent. Only four per cent of parents/carers disagreed with the statement.
Table 13.10: Level of agreement of parents and carers with the statement ‘They communicate with me regularly about my child’s progress’ by SIMD
Percentage of households, 2018 data
| Level of Agreement | 1 - Most Deprived | 2 | 3 | 4 | 5 - Least Deprived | All |
|---|---|---|---|---|---|---|
| Strongly agree | 61 | 71 | 65 | 69 | 54 | 64 |
| Tend to agree | 33 | 26 | 33 | 27 | 23 | 28 |
| Neither agree nor disagree | - | 3 | - | 1 | 12 | 3 |
| Tend to disagree | 3 | - | 2 | 3 | 8 | 3 |
| Strongly disagree | 2 | - | - | - | 3 | 1 |
| Don't know | 2 | - | - | - | - | 0 |
| All | 100 | 100 | 100 | 100 | 100 | 100 |
| Base | 60 | 60 | 60 | 50 | 60 | 290 |
13.5 Childcare Costs
This section presents the amount spent on childcare per month by SIMD and by household type during school term-time, for households who have a child aged between two and five years and not yet at school. It does not cover all childcare costs for the household as it only includes costs for the selected child aged between two and five years old.
13.5.1 Average amount spent on childcare per month by SIMD
Figure 13.8 shows the amount spent on childcare per household on their child aged between two and five years old during school term-time as a percentage of their net household annual income. Some of these children will be accessing Scottish Government or local authority funded ELC, reducing their childcare costs.
Just over half (52 per cent) of households had no childcare costs. The percentage of households that did not pay towards childcare or where all childcare was funded by the Scottish Government or their local authority, varied by area deprivation and decreased from 66 per cent of households in the most deprived areas to 35 per cent in the least deprived areas.
Due to this, there was a corresponding increase in the percentage of households spending up to 10 per cent of their income on childcare from the most deprived to the least deprived areas from 22 per cent to 42 per cent of households. The same trend follows for households spending between 10 and 20 per cent of their income, increasing from six per cent in the most deprived areas to 16 per cent in the least deprived areas.
Overall, two per cent of households spent more than 30 per cent of their income on childcare. This did not vary by area deprivation.
Figure 13.8: Amount spent on childcare as a percentage of household income during school term-time by SIMD[165]
Percentage of households, 2018 data (minimum base: 90)
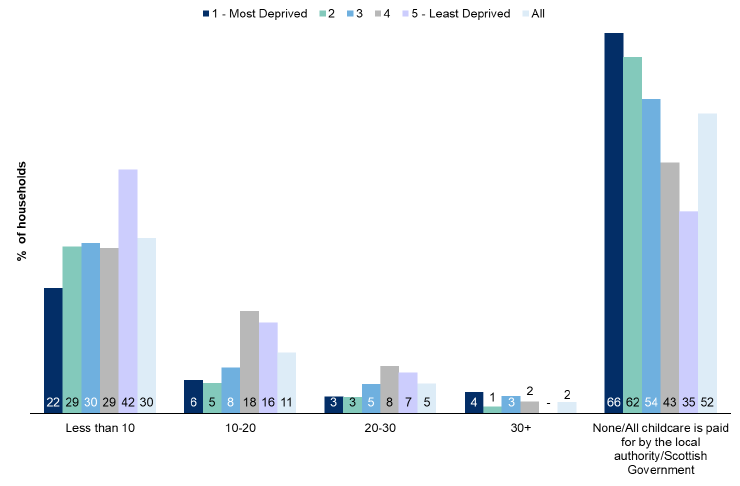
Figure 13.9 shows the amount spent on childcare during school term-time as a percentage of household income by household type. For 64 per cent of single parent families and 67 per cent of large families (households with three or more children) all childcare was either funded by the local authority or the Scottish Government or was free. Small families were more likely to spend money on childcare than the other household types as only 43 per cent stated that they did not spend anything on childcare.
A higher percentage of small families spent up to 30 per cent of their income on childcare compared with other household types. Seven per cent of single parent families spent more than 30 per cent of their income on childcare, which is the highest percentage amongst the three household types.
Figure 13.9: Amount spent on childcare as a percentage of household income by household type during school term-time[166]
Percentage of households, 2018 data (minimum base: 110)
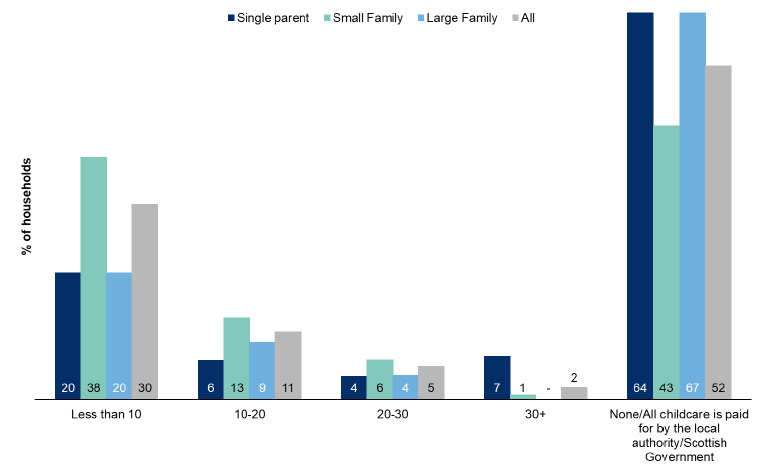
Table 13.11 shows spend on childcare during school holidays for households who were using some kind of childcare for a child aged between two and five years old (and not yet at school). Over two in five (44 per cent) households either did not pay towards childcare or all childcare was paid for by their local authority or the Scottish Government during the holidays. Thirty-one per cent of households spent up to 10 per cent of their income on childcare, and 15 per cent of households spent between 10 and 20 per cent of their income on childcare.
Table 13.11: Amount spent on childcare as a percentage of household income during school holidays[167]
Percentage of households, 2018 data
| Per cent of Household Income | All |
|---|---|
| Less than 10 | 31 |
| 11-20 | 15 |
| 20-30 | 8 |
| 30+ | 3 |
| None/All childcare is paid for by the local authority/Scottish Government | 44 |
| All | 100 |
| Base | 260 |
Table 13.12 shows the percentage of households that used salary sacrifice childcare vouchers or tax-free childcare to pay for childcare for any of their children aged 0 to 11 years old. Twenty-seven per cent of households used salary sacrifice childcare vouchers and 10 per cent of households used tax-free childcare to pay towards their childcare expenses.
Table 13.12: Percentage of households that pay for childcare with salary sacrifice childcare vouchers or through tax-free childcare
Percentage of households, 2018 data
| Responses | All |
|---|---|
| Yes, salary sacrifice childcare vouchers | 27 |
| Yes, tax-free childcare | 10 |
| No | 61 |
| Don’t know | 2 |
| All | 100 |
| Base | 260 |
13.5.2 Affordability: How easy/difficult it is to afford childcare by SIMD
Table 13.13 shows the affordability of childcare for households with a child aged between two and five years old who are not yet at school and are paying for some type of childcare. This information refers to household childcare costs, so the costs may cover childcare for multiple children.
Table 13.13 shows that the majority of households (72 per cent) said that they did not find it difficult to afford childcare. However, 17 per cent of households said they find it difficult to afford childcare and 11 per cent stated it was very difficult.
Households in the 20 per cent least deprived areas were less likely to find it difficult to afford childcare compared to households in the rest of Scotland: 15 per cent of households from the 20 per cent least deprived areas found it difficult to afford childcare compared with 33 per cent from the rest of the Scotland. Three per cent in the least deprived areas stated it was very difficult to afford, compared with 15 per cent for the rest of Scotland.
Table 13.13: How easy/difficult it is to afford childcare by SIMD (20 per cent least deprived to rest of Scotland)
Percentage of households, 2018 data
| Responses | 20 per cent Least deprived | Rest of Scotland | All |
|---|---|---|---|
| Very easy | 17 | 12 | 13 |
| Easy | 26 | 22 | 23 |
| Neither easy nor difficult | 42 | 32 | 35 |
| Difficult | 12 | 19 | 17 |
| Very difficult | 3 | 15 | 11 |
| All | 100 | 100 | 100 |
| Base | 80 | 180 | 260 |
Contact
Email: shs@gov.scot
There is a problem
Thanks for your feedback