Scottish household survey 2018: annual report
Results from the 2018 edition of the continuous survey based on a sample of the general population in private residences in Scotland.
6 Finance
Main Findings
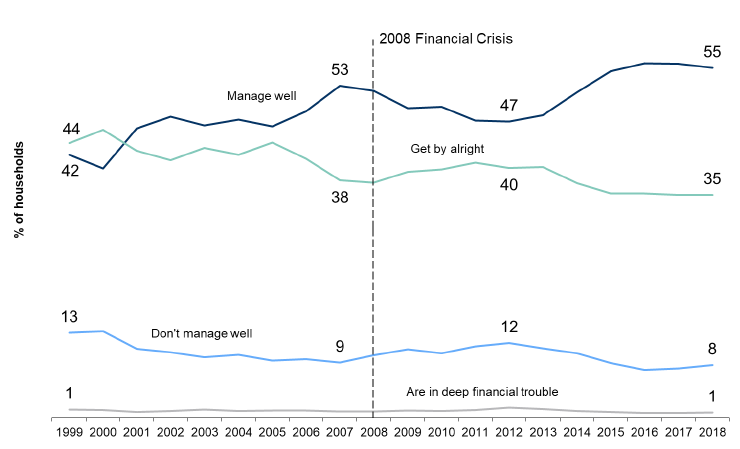
Overall, the proportion of households reporting they were managing well financially increased, from 42 per cent in 1999 to 55 per cent in 2018. The recent levels suggest a period of recovery following the dip between 2007 and 2012, which may be explained in part by the economic downturn during that period.
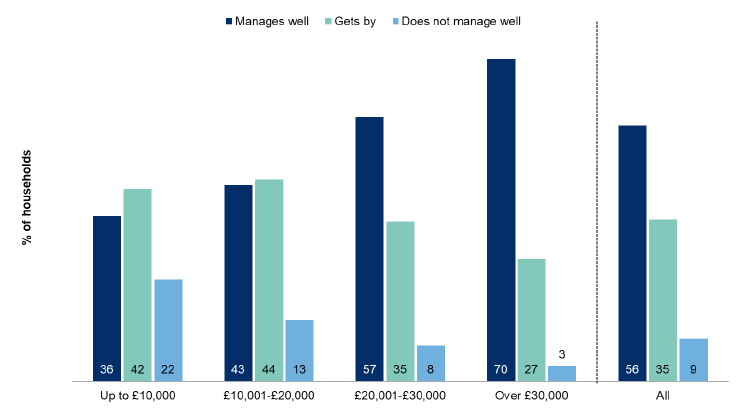
The proportion of households reporting that they managed well financially increased with household income. Although the majority of households on incomes up to £10,000 said they managed well or got by, over one in five (22 per cent) said they did not manage well - higher than the overall average of nine per cent.
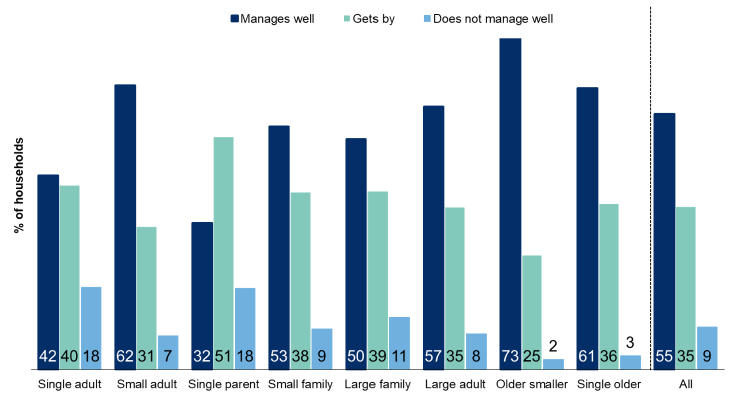
As in previous years, single parent and single adult households were the most likely to report that they were not managing well financially (both 18 per cent), both figures above the Scotland average of nine per cent.
Owner occupiers were most likely to report they were managing well (69 per cent compared to 28 per cent for households in the social rented sector).
Households relying mainly on benefits were the most likely to say they were not managing well with one in six households (16 per cent) reporting as such, nearly double the overall rate of nine per cent.
In contrast, only two per cent of households relying on other sources of income (including occupational pension and other investments) reported that they were not managing well.
Households where the highest income householder (HIH) was male were more likely to say they managed well compared to where the HIH was female (60 per cent and 49 per cent respectively).
Levels of perceived financial difficulty were higher in areas of deprivation as measured by the Scottish Index of Multiple Deprivation; 20 per cent for households in the 10 per cent most deprived areas, falling consistently to two per cent for households in the 10 per cent least deprived areas.
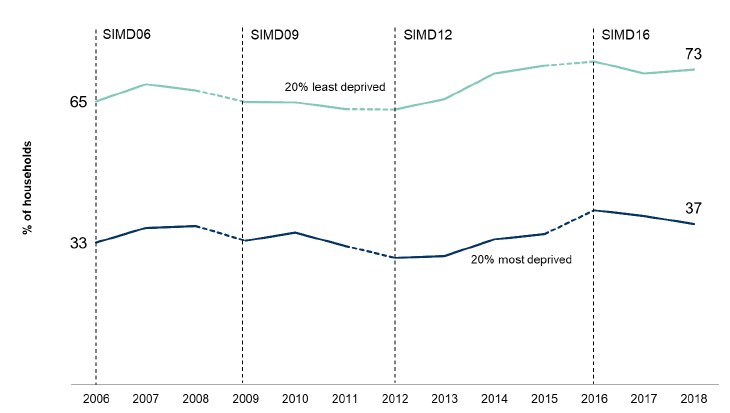
Since 2006, there has consistently been a gap between those in the 20 per cent most and least deprived areas, with households in the most deprived areas being less likely to say they were managing well financially.
6.1 Introduction and Context
The Scottish Government is committed to reducing levels of poverty and inequality and building a fairer and more prosperous country where everyone can reach their full potential.
To help realise this ambition the Fairer Scotland Action Plan[75] was published in October 2016. The Plan committed 50 concrete actions to deliver progress in this Parliamentary term. Since publication, progress has been made[76], including the introduction of a new Fairer Scotland Duty, ensuring selected public bodies take account of poverty and disadvantage when making key decisions, delivery of 25,405 affordable homes (between April 2016 to March 2019), against a target of 50,000 and the enactment of the Child Poverty (Scotland) Act 2017, setting ambitious income-based targets to reduce child poverty by 2030.
Tackling Child Poverty remains a priority for the Scottish Government. We published the first Tackling Child Poverty Delivery Plan[77] in March 2018, and in June 2019, we provided a first annual update on progress[78]. This sets out that many of the actions committed are now in progress, with families being supported by enhanced Early Learning and Childcare (ELC), a new Best Start Grant and increased School Clothing Grant.
Analysis published shows that in 2018-19 over £527 million of investment is estimated to have been directly targeted at low income families with children – not including universal services such as ELC, education and health. The Scottish Government has also committed to introduce the Scottish Child Payment, which will give eligible families £10 a week for every child under 16 by the end of 2022, with early introduction for under sixes starting in early 2021.
6.2 How Households are Managing Financially
Respondents are asked how they feel the household has coped financially over the last year. Figure 6.1 shows the trend since 1999.
Overall, the proportion of households reporting they were managing well financially increased, from 42 per cent in 1999 to 55 per cent in 2018. The recent levels suggest a period of recovery following the dip between 2007 and 2012, which may be explained in part by the economic downturn during that period. The proportion of households reporting that they got by alright shows a mirror trend, with an overall decrease from 44 to 35 per cent between 1999 and 2018.
The proportion of households who reported they did not manage well or were in deep financial trouble showed a flatter trend, with some small peaks and troughs in response to the economic downturn.
Figure 6.1: How households are managing financially by year
1999-2018 data[79], Households dataset (minimum base: 3,660)
Household perceptions of how they managed financially varied by household income (Figure 6.2). While the majority of households on incomes up to £10,000 said that they managed well or got by (36 and 42 per cent respectively), over one in five (22 per cent) said they did not manage well - higher than the overall average of nine per cent.
The proportion of households reporting that they manage well financially increased with household income. Seven in 10 (70 per cent) households with incomes over £30,000 reported that they were managing well, compared to 57 per cent for households with incomes between £20,000-£30,000, and 36 per cent for households in the lowest income category.
The proportion of households reporting that they did not manage well shows a mirror trend, with an overall decrease from 22 per cent to three per cent between the lowest and highest income bands.
Figure 6.2: How the household is managing financially by net annual household income
2018 data, Households dataset (minimum base: 980)
Perceptions of managing household finances varied by household type[80] (Figure 6.3). Single parent households and single adult households were the most likely to report that they were not managing well financially: just over one in six (18 per cent) for both groups, compared to nine per cent overall. In contrast, older smaller and single older households were the least likely to report that they were not managing well financially (two per cent and three per cent respectively).
Figure 6.3: How the household is managing financially by household type
2018 data, Households dataset (minimum base: 500)
Perceptions of managing financially varied with household tenure (Figure 6.4). Owner occupiers were the most likely to report they were managing well (69 per cent compared to 28 per cent for households in the social rented sector) and least likely to say they were not managing well (four per cent compared to 22 per cent in the social rented sector). A more detailed breakdown by tenure can be found in Chapter 3.3.
Figure 6.4: How the household is managing financially by tenure of household
2018 data, Households dataset (minimum base: 120)
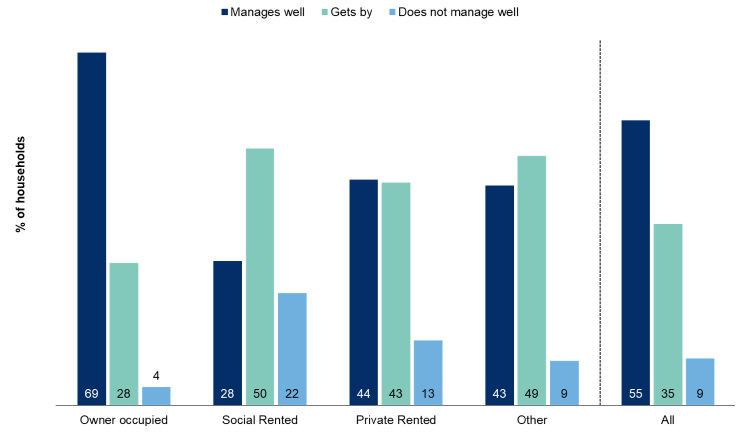
Table 6.1 shows how households were managing financially by their main income source. Households relying mainly on benefits (including state pensions) were the most likely to say they were not managing well (16 per cent), nearly double the overall rate of nine per cent. Only two per cent of households relying on ‘other’ sources[81] reported that they were not managing well.
Table 6.1: How the household is managing financially by income sources
Column percentages, 2018 data, Households dataset
| Managing financially | Main income from earnings | Main income from benefits | Main income from other sources | An equal mix of income sources | All |
|---|---|---|---|---|---|
| Manages well | 58 | 42 | 80 | * | 56 |
| Gets by | 35 | 42 | 18 | * | 35 |
| Does not manage well | 7 | 16 | 2 | * | 9 |
| Total | 100 | 100 | 100 | 100 | 100 |
| Base | 5,620 | 3,240 | 1,170 | 10 | 10,030 |
* Excludes Refused and Don't know answers
Households where the highest income householder (HIH) was a man were more likely to say they managed well (Table 6.2), with three fifths (60 per cent) saying so compared to a half (49 per cent) of households where the HIH was a woman. The proportion of households reporting that they were managing well was higher for older (60 and over) householders.
Table 6.2: How the household is managing financially by gender[82] and age of the highest income householder
Column percentages, 2018 data, Households dataset
| Managing financially | Men | Women | Identified in another way | Refused | 16 to 24 | 25 to 34 | 35 to 44 | 45 to 59 | 60 to 74 | 75 plus | All |
|---|---|---|---|---|---|---|---|---|---|---|---|
| Manages well | 60 | 49 | * | * | 53 | 48 | 49 | 52 | 63 | 68 | 55 |
| Gets by | 32 | 40 | * | * | 39 | 40 | 38 | 36 | 32 | 31 | 35 |
| Does not manage well | 8 | 11 | * | * | 9 | 11 | 13 | 13 | 5 | 2 | 9 |
| Total | 100 | 100 | 100 | 100 | 100 | 100 | 100 | 100 | 100 | 100 | 100 |
| Base | 6,080 | 4,350 | 0 | 0 | 380 | 1,270 | 1,520 | 2,990 | 2,710 | 1,570 | 10,440 |
* Excludes Refused and Don't know answers
Levels of perceived financial difficulty were higher in areas of deprivation as measured by the Scottish Index of Multiple Deprivation (SIMD)[83] (Figure 6.5). Twenty per cent of households in the 10 per cent most deprived areas reported not managing well, falling consistently with levels of deprivation to two per cent for households in the 10 per cent least deprived areas.
Figure 6.5: How households are managing financially by the Scottish Index of Multiple Deprivation
2018 data, Households dataset (minimum base: 930)
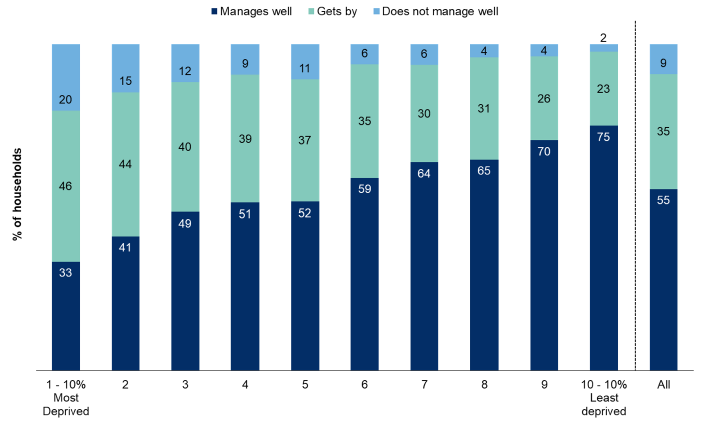
Figure 6.6 shows changes over time for the proportion of households who manage well financially in the 20 per cent most and least deprived areas. The trends over time are similar for both groups as described in relation to Figure 6.1. Since 2006, there has consistently been a gap between those in the 20 per cent most and least deprived areas, with households in the most deprived areas being less likely to say they were managing well financially.
Figure 6.6: Households who manage well financially by deprivation[84] over time
2006 - 2018 data, Households dataset (minimum base: 6,800)
Contact
Email: shs@gov.scot
There is a problem
Thanks for your feedback