Scottish household survey 2018: annual report
Results from the 2018 edition of the continuous survey based on a sample of the general population in private residences in Scotland.
9 Local Services
Main Findings
In 2018, 51.7 per cent of adults were satisfied with all three of the main public services, local health services, schools and public transport. This is a composite measure of the three services, and this composite indicator is the Scottish Government's National Indicator on ’quality of public services’[101]. The indicator is based on the percentage of adults who said that they were very or fairly satisfied with all three services, or for one or two services if they chose to express “no opinion” on the other service(s).
Combined satisfaction with the three public services was at its lowest level since first measured in 2007, and down from a peak of 66.0 per cent in 2011 – the largest factor being a fall in satisfaction with local schools over the same period.
The percentage of people dissatisfied with at least one of these three public services has increased since 2009, from 20 per cent to 28 per cent.
In 2018, 81 per cent of adults were satisfied with local health services, compared to 71 per cent who were satisfied with schools and 65 per cent with public transport.
Satisfaction with schools has fallen over the last seven years, from a high of 85 per cent in 2011 to the current level of 71 per cent, and this is the biggest factor in the corresponding trend in the combined indicator over this period – though satisfaction with the other two services has also fallen since 2011. The reason local schools satisfaction has fallen is almost entirely due to a corresponding increase from 11 per cent to 22 per cent in the number of people who are neither satisfied nor dissatisfied. The number of people who are very or fairly dissatisfied with local schools has remained fairly stable until 2011, increasing slightly from four per cent in 2011 to seven per cent in 2018.
Adults living in urban areas were more satisfied with the quality of the three public services than those in rural areas – almost entirely due to greater satisfaction with public transport in urban areas.
Eight out of 10 respondents were satisfied with local health services, independent of whether they used the service or not.
Service users were more satisfied with local schools and public transport than that of the whole adult population. This trend has been more stable over time, but since 2016 user satisfaction has been declining for public transport.
In 2018, four in five adults (80 per cent) felt that they can’t influence decisions affecting their local area. Around a third (34 per cent) said they would like to be more involved in the decisions their council makes, a decrease from 38 per cent in 2007. Younger people were more likely to want to be more involved in making decisions.
Generally, older adults were more likely than younger adults to say they are satisfied with local government performance and less likely to want to be more involved in making decisions.
9.1 Introduction and Context
High quality public services which work together and with Scotland’s communities are essential to support a fair, prosperous and inclusive society. The Scottish Government’s approach to public service delivery seeks to place people and communities at the centre of what we do. In particular, it is an approach designed to target the causes rather than the consequences of inequalities; and to make sure that our public services are sustainable.
The National Performance Framework (NPF)[102], which is supported by local councils, contains two National Indicators relating to public services where progress is monitored using data from this section of the Scottish Household Survey (SHS): “quality of public services” and “influence over local decisions”.
Scotland's 32 local authorities work closely with other organisations in a range of partnerships, including Community Planning Partnerships (CPP), to plan and deliver a wide range of services that improve the lives of people living in their areas. Under the Community Empowerment (Scotland) Act 2015, community planning is about how public bodies work together and with the local community to plan for, resource and provide or secure the provision of services which improve local outcomes in a local authority area, with a view to reducing inequalities. Each CPP must produce a Local Outcomes Improvement Plan which is collaboratively agreed. Many CPPs use the SHS to assess progress within their Local Outcomes Improvement Plans.
This chapter begins by exploring satisfaction with the quality of local services. It then reports respondents' views on local authority performance and attitudes to involvement in local decision-making.
9.2 Local Service Quality
9.2.1 Satisfaction among all adults in Scotland
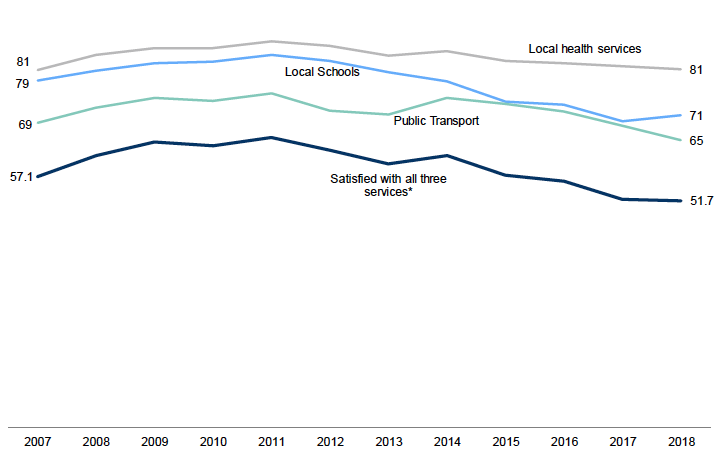
The Scottish Government's National Indicator ‘quality of public services' is measured by the percentage of adults who say they are (very or fairly) satisfied with three public services: local health services, schools and public transport. Over the last year, the percentage of adults who said they were very or fairly satisfied with these services remained stable, with satisfaction at 51.7 per cent in 2018. However, satisfaction has decreased from 66.0 per cent in 2011 and is at its lowest level since first measured in 2007 (Table 9.1 and Figure 9.1).
Looking at the services individually, adults tended to be most satisfied with local health services. In 2018, 81 per cent of adults were satisfied with local health services, compared to 71 per cent who were satisfied with schools and 65 per cent with public transport. Satisfaction with schools has fallen over the last seven years, from a high of 85 per cent in 2011 to the current level of 71 per cent, and this is the biggest factor in the corresponding trend in the combined indicator over this period – though satisfaction with the other two services has also fallen since 2011.
Table 9.1: Percentage of people very or fairly satisfied[103] with the quality of public services delivered (local health services, local schools and public transport) by year
Percentages, 2007-2018 data
| Adults | 2007 | 2008 | 2009 | 2010 | 2011 | 2012 | 2013 | 2014 | 2015 | 2016 | 2017 | 2018 |
|---|---|---|---|---|---|---|---|---|---|---|---|---|
| Local Health Services | 81 | 85 | 86 | 86 | 88 | 87 | 85 | 86 | 83 | 83 | 82 | 81 |
| Local Schools | 79 | 81 | 83 | 83 | 85 | 83 | 81 | 79 | 74 | 73 | 70 | 71 |
| Public Transport | 69 | 73 | 75 | 74 | 76 | 72 | 71 | 75 | 74 | 72 | 69 | 65 |
| % satisfied with all three services* | 57.1 | 61.8 | 64.9 | 64.0 | 66.0 | 63.0 | 59.9 | 61.9 | 57.5 | 56.1 | 51.9 | 51.7 |
| Base (minimum) | 6,270 | 5,500 | 5,470 | 5,000 | 5,510 | 5,340 | 5,700 | 5,720 | 5,790 | 6,130 | 6,260 | 5,780 |
Figure 9.1: Percentage of people very or fairly satisfied with the quality of public services delivered (local health services, local schools and public transport) by year
2007 - 2018 data, Adults (min base: 5,000)

Table 9.2 provides a more detailed breakdown of satisfaction levels with each of the three public services. While the number of adults very or fairly satisfied with local schools has fallen from 85 per cent to 71 per cent since 2011, this is mainly due to a corresponding increase from 11 per cent to 22 per cent in the number of people who were neither satisfied nor dissatisfied – there has not been a large increase in the number of people expressing dissatisfaction with local schools.
Satisfaction levels have also fallen since 2011 for both local health services and public transport. In both cases, there has been an increase over this period in the number of people who were very or fairly dissatisfied – from eight per cent to 12 per cent for local health services and from 14 per cent to 19 per cent for public transport. The percentage of people dissatisfied with at least one of the three public services has increased since 2011, from 20 per cent to 28 per cent.
Table 9.2: Percentage of people very or fairly satisfied with the quality of public services delivered (local health services, local schools and public transport) by year
Percentages, 2007-2018 data
| Adults | 2007 | 2008 | 2009 | 2010 | 2011 | 2012 | 2013 | 2014 | 2015 | 2016 | 2017 | 2018 |
|---|---|---|---|---|---|---|---|---|---|---|---|---|
| Local Health Services | ||||||||||||
| Very or fairly satisfied | 81 | 85 | 86 | 86 | 88 | 87 | 85 | 86 | 83 | 83 | 82 | 81 |
| Neither satisfied nor dissatisfied | 7 | 6 | 5 | 5 | 4 | 5 | 6 | 5 | 6 | 6 | 6 | 6 |
| Very or fairly dissatisfied | 12 | 10 | 9 | 9 | 8 | 9 | 10 | 9 | 11 | 11 | 12 | 12 |
| Local Schools | ||||||||||||
| Very or fairly satisfied | 79 | 81 | 83 | 83 | 85 | 83 | 81 | 79 | 74 | 73 | 70 | 71 |
| Neither satisfied nor dissatisfied | 17 | 14 | 12 | 12 | 11 | 13 | 15 | 18 | 22 | 22 | 25 | 22 |
| Very or fairly dissatisfied | 4 | 5 | 5 | 5 | 4 | 3 | 4 | 3 | 4 | 5 | 5 | 7 |
| Public Transport | ||||||||||||
| Very or fairly satisfied | 69 | 73 | 75 | 74 | 76 | 72 | 71 | 75 | 74 | 72 | 69 | 65 |
| Neither satisfied nor dissatisfied | 14 | 12 | 11 | 12 | 10 | 14 | 12 | 13 | 12 | 15 | 15 | 15 |
| Very or fairly dissatisfied | 17 | 15 | 14 | 14 | 14 | 14 | 17 | 11 | 14 | 13 | 16 | 19 |
| Composite Measure | ||||||||||||
| Satisfied with all three | 57 | 62 | 65 | 64 | 66 | 63 | 60 | 62 | 57 | 56 | 52 | 52 |
| Not dissatisfied with any, but not satisfied with all | 18 | 16 | 15 | 16 | 14 | 17 | 17 | 19 | 20 | 22 | 23 | 21 |
| Dissatisfied with at least one | 25 | 22 | 20 | 20 | 20 | 20 | 23 | 19 | 23 | 22 | 25 | 28 |
| Base (minimum) | 6,270 | 5,500 | 5,470 | 5,000 | 5,510 | 5,340 | 5,700 | 5,720 | 5,790 | 6,130 | 6,260 | 5,780 |
Table 9.3 shows the differences in people’s perceptions of public services by urban rural classification. Overall, adults living in urban areas were more satisfied with the quality of public services than those in rural areas. However, this is almost entirely due to differences in satisfaction with public transport – satisfaction with public transport in large urban areas was 77 per cent in 2018, compared to only 46 per cent in remote rural areas. Rural areas and urban areas had similar satisfaction with local health services (84 per cent in both remote rural and large urban areas), while rural areas had slightly higher satisfaction with local schools (75 per cent in accessible rural areas compared with 70 per cent in large urban areas)
Table 9.3: Percentage of people very or fairly satisfied with the quality of public services delivered (local health services, local schools and public transport) by urban rural classification
Percentages, 2018 data
| Adults | Large urban areas | Other urban areas | Accessible small towns |
Remote small towns | Accessible rural | Remote rural | Scotland |
|---|---|---|---|---|---|---|---|
| Local Health Services | 84 | 79 | 82 | 80 | 79 | 84 | 81 |
| Local Schools | 70 | 70 | 73 | 73 | 75 | 73 | 71 |
| Public Transport | 77 | 65 | 58 | 61 | 44 | 46 | 65 |
| % satisfied with all three services* | 60.0 | 50.0 | 46.0 | 51.0 | 41.0 | 42.0 | 52.0 |
| Base (minimum) | 1,560 | 2,010 | 510 | 410 | 620 | 670 | 5,780 |
Table 9.4 shows the differences in people’s perceptions of public services by level of deprivation, as defined using the Scottish Index of Multiple Deprivation (SIMD) and divided into quintiles[104]. Overall satisfaction with the quality of public services was broadly similar across all levels of deprivation, although satisfaction was higher in both the most and least deprived quintiles due to higher levels of satisfaction with public transport.
Table 9.4: Percentage of people very or fairly satisfied with the quality of public services delivered (local health services, local schools and public transport) by Scottish Index of Multiple Deprivation quintiles
Percentages, 2018 data
| Adults | ← 20% most deprived | 20% least deprived→ | Scotland | |||
|---|---|---|---|---|---|---|
| 1 | 2 | 3 | 4 | 5 | ||
| Local Health Services | 82 | 81 | 79 | 82 | 84 | 81 |
| Local Schools | 69 | 70 | 69 | 73 | 74 | 71 |
| Public Transport | 71 | 70 | 60 | 60 | 67 | 65 |
| % satisfied with all three services* | 54.0 | 54.0 | 47.0 | 50.0 | 54.0 | 52.0 |
| Base (minimum) | 1,100 | 1,110 | 1,270 | 1,250 | 1,050 | 5,780 |
9.2.2 Satisfaction among service users only
The SHS allows us to identify users of services and establish if the views of service users are different to those of the population as a whole.
Table 9.5 shows satisfaction with the three public services among service users only. Satisfaction with both schools (86 per cent) and public transport (72 per cent) was higher in 2018 among those who used these services compared to the corresponding satisfaction level for the whole adult population. Satisfaction with health services (82 per cent) among users was similar to the whole adult population. Satisfaction of service users was more stable over time than that of all adults. This suggests that public opinion of services may be formed by more than current personal experience of those services.
Table 9.5: Percentage of service users very or fairly satisfied with the quality of public services delivered (local health services, local schools and public transport) by year[105]
Percentages, 2007-2018 data
| Service users | 2007 | 2008 | 2009 | 2010 | 2011 | 2012 | 2013 | 2014 | 2015 | 2016 | 2017 | 2018 |
|---|---|---|---|---|---|---|---|---|---|---|---|---|
| Local Health Services | n/a | n/a | n/a | n/a | n/a | n/a | n/a | n/a | n/a | n/a | 83 | 82 |
| Local Schools | 90 | 89 | 88 | 88 | 90 | 92 | 90 | 90 | 90 | 88 | 87 | 86 |
| Public Transport | 77 | 80 | 81 | 80 | 82 | 80 | 78 | 82 | 79 | 80 | 76 | 72 |
| Base (minimum) | 2,040 | 1,740 | 1,880 | 1,650 | 1,800 | 1,750 | 1,820 | 1,780 | 1,690 | 1,740 | 1,660 | 1,580 |
9.3 Perceptions of Local Authority Performance and Involvement in Local Decision Making
The Scottish Government’s approach continues to be informed by the findings of the Christie Commission on the Future Delivery of Public Services in 2011[106], providing consistent and clear strategic direction built around the four pillars of reform: partnership; prevention; people and performance. This approach places people and communities at the centre of public service delivery and policy making.
As well as satisfaction with local services, perceptions of local authority performance are measured in the SHS by asking people to indicate their level of agreement or disagreement with various statements relating to the role of a local council and the perceived quality of communication and services, involvement in decision making, and value for money.
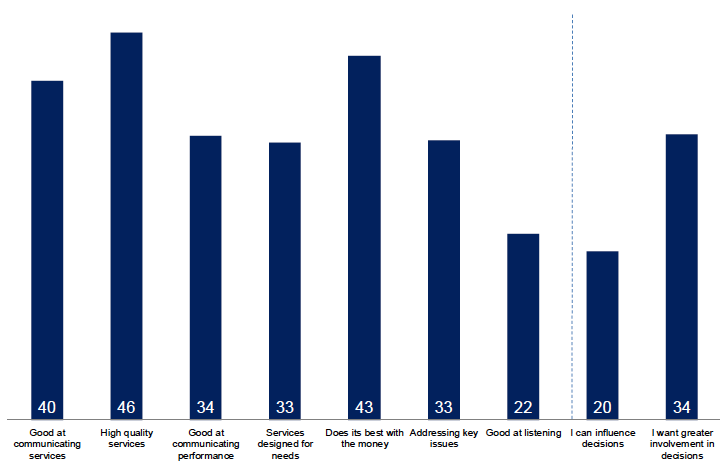
Figure 9.2 shows the percentage of adults who agreed (strongly or slightly) with these statements about different aspects of their local authority's performance. The highest level of agreement was amongst those who said their council provides high quality services (46 per cent) and does its best with the money available (43 per cent).
The lowest levels of agreement were with statements about being able to influence decisions in their local area (20 per cent) and the council being good at listening to local people's views (22 per cent).
Figure 9.2: Percentage agreeing with various statements about local authority services and performance
2018 data, Adults (base: 9,700)

The National Performance Framework National Indicator ‘Influence over local decisions’ is measured as the percentage of adults in the SHS who agree that they can influence decisions affecting their local area.
In 2018, 20.1 per cent of people agreed that they can influence decisions affecting their local area, as shown in Table 9.6. This is a decrease of 2.6 percentage points since last year, and is similar to the level of 19.6 per cent in 2007 – the lowest level since first measured.
Table 9.6: Percentage of people who agree with the statement 'I can influence decisions affecting my local area' by year
Percentages, 2007-2018 data
| Adults | 2007 | 2008 | 2009 | 2010 | 2011 | 2012 | 2013 | 2014 | 2015 | 2016 | 2017 | 2018 |
|---|---|---|---|---|---|---|---|---|---|---|---|---|
| I can influence decisions | 19.6 | 21.7 | 21.8 | 21.3 | 22.4 | 21.5 | 22.0 | 23.0 | 23.6 | 23.1 | 22.7 | 20.1 |
| Base (minimum) | 10,230 | 9,250 | 9,710 | 9,020 | 9,660 | 9,890 | 9,920 | 9,800 | 9,410 | 9,640 | 9,810 | 9,700 |
In 2018, 34 per cent of adults said they would like to be more involved in the decisions their council makes that affects their local area, compared to 20 per cent who felt they can influence decisions affecting their local area (Figure 9.2). Around a fifth (22 per cent) of adults agreed that their council is good at listening to local people’s views before it takes decisions.
Table 9.7 shows how level of agreement with the nine statements has changed over time. The percentage of people who agreed that their local council is good at communicating services and good at communicating performance were both relatively stable between 2007 and 2014. Since then the percentage who said that their local council is good at communicating services has declined (from 49% to 40%), as has the percentage who said that their local council is good at communicating performance (from 41 per cent to 34 per cent). The percentage of people who said that services are designed to meet their needs has also fallen in recent years (from 40 per cent in 2016 to 33 per cent in 2018).
Table 9.7: Percentage agreeing with various statements about local authority services and performance by year
Percentages, 2007-2018 data
| Adults | 2007 | 2008 | 2009 | 2010 | 2011 | 2012 | 2013 | 2014 | 2015 | 2016 | 2017 | 2018 |
|---|---|---|---|---|---|---|---|---|---|---|---|---|
| Good at communicating services | 47 | 48 | 49 | 48 | 49 | 48 | 48 | 49 | 46 | 45 | 43 | 40 |
| High quality services | 40 | 42 | 43 | 42 | 44 | 44 | 45 | 47 | 46 | 45 | 41 | 46 |
| Good at communicating performance | 42 | 42 | 41 | 41 | 40 | 41 | 40 | 41 | 38 | 37 | 34 | 34 |
| Services designed for needs | 32 | 34 | 38 | 39 | 39 | 40 | 40 | 41 | 40 | 40 | 37 | 33 |
| Does its best with the money | 35 | 38 | 36 | 39 | 39 | 40 | 40 | 41 | 41 | 41 | 39 | 43 |
| Addressing key issues | 33 | 34 | 34 | 34 | 34 | 35 | 36 | 37 | 36 | 36 | 33 | 33 |
| Good at listening | 21 | 22 | 23 | 23 | 23 | 25 | 25 | 26 | 25 | 25 | 24 | 22 |
| I can influence decisions | 20 | 22 | 22 | 21 | 22 | 21 | 22 | 23 | 24 | 23 | 23 | 20 |
| I want greater involvement in decisions | 38 | 37 | 36 | 36 | 36 | 33 | 35 | 34 | 34 | 34 | 33 | 34 |
| Base (minimum) | 10,230 | 9,250 | 9,710 | 9,020 | 9,660 | 9,890 | 9,920 | 9,800 | 9,410 | 9,640 | 9,810 | 9,700 |
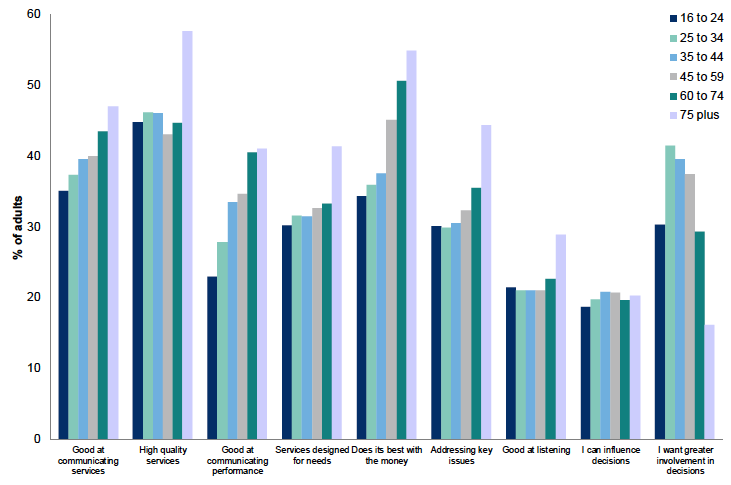
Figure 9.3 shows that there are some differences by age group in agreement with statements about local authority services and performance. Generally, older adults were more likely than younger adults to say they were satisfied with the performance statements about local government services and less likely to want to be more involved in making decisions. Around half of 60 to 74 year olds (51 per cent) and those aged 75 years and over (55 per cent) agreed with the statement that their council does the best it can with the money available, compared to around one third of 16 to 24 (34 per cent) and 25 to 34 year olds (36 per cent).
The strongest desire to participate in local decision-making was shown by those aged 25 to 34, with 41 per cent saying they would like to have greater involvement with decisions affecting their local area compared to 29 per cent for those aged 60-74, and 16 per cent for those 75 and above. The percentage who felt that they can influence decisions was similar across all age groups.
Figure 9.3: Percentage agreeing with various statements about local council services by age
2018 data, Adults (min base: 680)

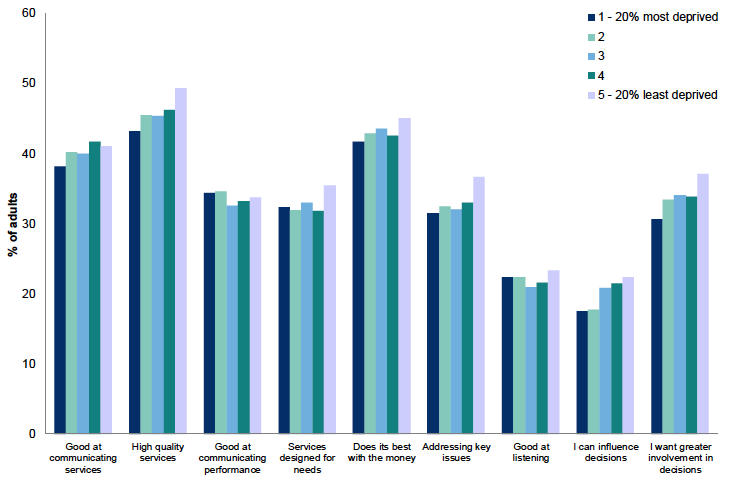
Figure 9.4 looks at differences in agreement with statements about local authority performance by the level of deprivation of the area, as defined using the Scottish Index of Multiple Deprivation (SIMD) and divided into quintiles. Levels of agreement with most statements were similar across areas, regardless of deprivation levels.
Perceptions of ability to influence decisions and the desire to be involved in decision-making were lower in the most deprived areas compared to the least deprived areas. Adults living in the most deprived areas were less likely to agree that they can influence decisions in their local area (18 per cent in the most deprived areas, compared to 22 per cent in the least deprived areas) and less likely to want to be more involved in local decision making, (31 per cent in the most deprived areas, compared to 37 per cent in the least deprived areas).
Figure 9.4: Percentage agreeing with various statements about local council services by the Scottish Index of Multiple Deprivation (SIMD)
2018 data, Adults (min base: 1,840)

Contact
Email: shs@gov.scot
There is a problem
Thanks for your feedback