The Scottish Health Survey 2023 - volume 1: main report
This report presents results for the Scottish Health Survey 2023, providing information on the health and factors relating to health of people living in Scotland.
8 Alcohol and Drugs
Sarah Minty
8.1 Introduction
Alcohol consumption has been identified as a risk factor for over 200 diseases, injuries, and health conditions and is linked to wider social and economic losses[134]. In 2023, 1,277 people in Scotland died from alcohol-specific causes, the highest number of annual deaths recorded since 2008[135].
The rate of drug deaths in Scotland is consistently higher than in the rest of the UK. This is predominantly driven by a cohort of long term, vulnerable drug users who have multiple complex needs. Polydrug use is a major component of Scotland’s drug death crisis, with more than one drug implicated in 81% of drug misuse deaths in 2023[136].
Existing inequalities mean that the burden of alcohol-related and drug-related morbidity and mortality is greatest among those living in the most deprived areas[137],9.
8.1.1 Policy background
The Scottish Government’s Alcohol Framework 2018: Preventing Harm[138] endorses the World Health Organization (WHO) Safer initiative of evidence-based strategies to tackle alcohol-related harm[139]. The framework includes actions related to putting the voices of children and young people at the heart of alcohol preventative measure development, supporting families and communities, keeping the licensing system and statutory guidance under review and consulting on marketing restrictions. The actions included in the framework are grouped into four key impacts focused on:
- Protecting young people
- Tackling health inequalities
- Improving national systems
- A whole population approach
A key strategy for tackling alcohol-related harm in Scotland was the introduction of minimum unit pricing (MUP) in 2018, setting the minimum cost of one unit of alcohol to 50p. Since then, the Scottish Parliament has agreed to continue the effect of the MUP legislation beyond 30 April 2024 and to raise the level it is set at to 65p per unit, aiming to increase its public health benefits. An independent evaluation of MUP suggests that, during the period it was reviewed, MUP was estimated to have reduced alcohol-related deaths by 13.4% and likely to have reduced hospital admissions by 4.1% compared to what would have happened if MUP had not been in place. The Scottish Government is taking forward further action to tackle alcohol harm including considering potential restrictions on alcohol marketing and advertising following the consultation that closed in 2023[140].
The National Drugs Mission Plan: 2022-2026[141] is to reduce drug deaths and improve the lives of those impacted by drugs. It is supported by an additional investment of £250m over the lifetime of the parliament. This is being done by putting in place actions to:
- prevent people from developing problem drug use;
- reduce harms from the consumption of drugs;
- get more people into high quality treatment and recovery services;
- address the needs of people with multiple and complex needs; and
- support families and communities affected by problem drug use.
To achieve this, the Scottish Government have made several commitments, including to expand the capacity of residential rehabilitation, implement Medication Assisted Treatment Standards, establish a Safer Drug Consumption Facility and implement a Human Rights Charter for people affected by substance use.
8.1.2 Reporting on harmful alcohol and drug use in the Scottish Health Survey
In this chapter the following data are presented for adults:
- weekly alcohol consumption
- Alcohol Use Disorders Identification Test (AUDIT) scores
- mental wellbeing (WEMWBS) by AUDIT score
- drug use in the last 12 months
- previous and current problem use of alcohol and/or drugs
- mental wellbeing (WEMWBS) by drug use
Figures are reported by age, sex and area deprivation.
The area deprivation data are presented in Scottish Index of Multiple Deprivation (SIMD) quintiles. To ensure that the comparisons presented are not confounded by the different age profiles of the quintiles, the data have been age-standardised. For a detailed description of both SIMD and age-standardisation as well as definitions of other terminology used in this chapter and for further details on the data collection methods for alcohol consumption and days on which alcohol was consumed, please refer to the Scottish Health Survey 2023 - volume 2: technical report.
8.1.3 Comparability with other UK statistics
The Health Survey for England[142], Health Survey Northern Ireland[143] and the National Survey for Wales[144] provide estimates of alcohol prevalence in the other UK countries. The surveys are conducted separately and have different sampling methodologies, so alcohol prevalence estimates across the surveys are only partially comparable.
Drug prevalence estimates are included in the Crime Survey[145] for England and Wales and the Drug Prevalence Survey for Northern Ireland[146]. The surveys are conducted separately and have different sampling methodologies, so drug prevalence estimates across the surveys are only partially comparable.
8.2 Results
Summary points
In 2023:
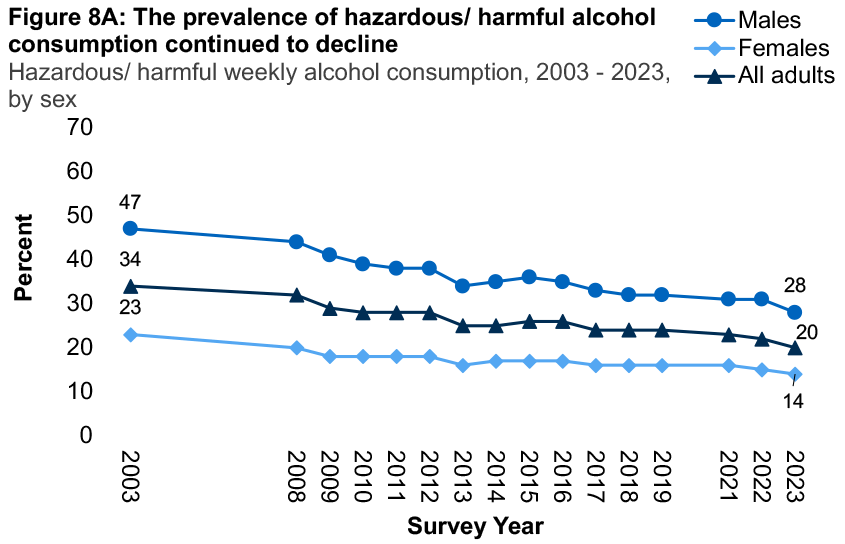
- The prevalence of hazardous or harmful alcohol consumption continued to decrease, with levels falling from 34% in 2003 to 20% in 2023. The proportion of males that drank to hazardous or harmful levels was twice as high as that of females (28% and 14% respectively).
- Among all adults, the prevalence of hazardous or harmful weekly alcohol consumption varied with age, with the highest levels recorded for those aged 65-74 (27%) followed by those aged 55-64 (25%).
- With the exception of 2021 (14%), the proportion of adults with an AUDIT score of eight or more (hazardous/ harmful drinking or possible alcohol dependency) has remained in the range 17% - 19% (18% in 2023).
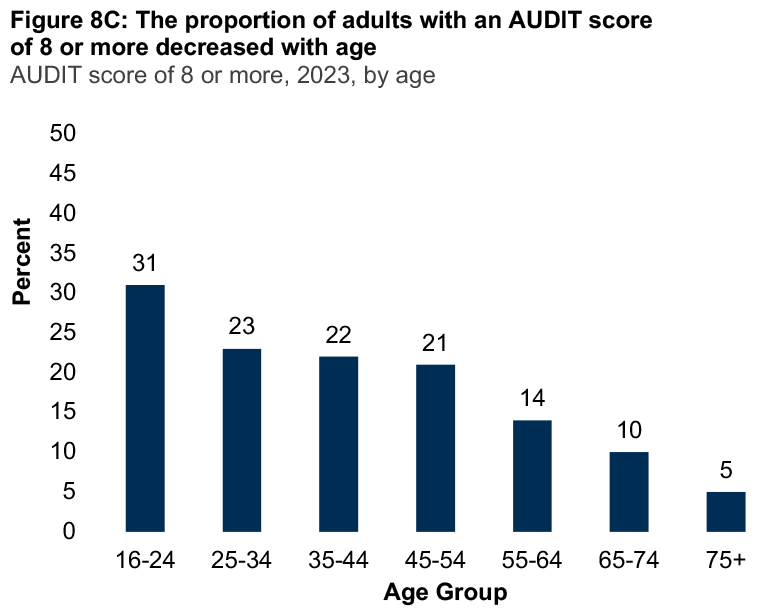
- The proportion of adults with an AUDIT score of 8 or more decreased with age, from 31% among those aged 16-24 to 5% among those aged 75 and over.
- Adults who were low risk drinkers or abstinent (AUDIT score of 0-7) recorded higher mental wellbeing than those who had an AUDIT score of 8+ (mean WEMWBS scores of 49.4 and 47.7 respectively).
- Adults living in the most deprived areas of Scotland were more likely to record an AUDIT score of eight or more.
- Fourteen per cent of adults reported drug use during the last 12 months. Prevalence was highest for those aged 16-34 (26%-27%) decreasing to 4%-6% of those aged 65 and over.
- Adults who had used any drug in the last 12 months reported lower mental wellbeing than those who had not used drugs (mean WEBWBS scores of 46.3 and 49.4 respectively).
8.2.1 The prevalence of hazardous or harmful alcohol consumption continued to decline in 2023
Prevalence of hazardous or harmful alcohol consumption among adults continued to decrease in 2023, with levels falling from 34% in 2003 to 20% in 2023.
In 2023, the proportion of males that drank to hazardous or harmful levels was twice as high as that of females (28% and 14% respectively), although there has been a decline for both sexes since 2003.
The mean units of alcohol consumed per week among adults has decreased from 16.1 in 2003 to 11.6 units in 2023. As in previous years, mean alcohol unit consumption in 2023 continued to be higher among males than females (15.2 units and 8.0 units respectively).
8.2.2 The prevalence of hazardous/harmful alcohol consumption varied with age, but it did not follow a linear pattern
In 2023, the prevalence of hazardous or harmful alcohol consumption among adults varied with age, with the highest levels recorded for those aged 65-74 (27%) followed by those aged 55-64 (25%) and those aged 16-24 (24%). Adults aged 25-34 were the least likely to report consuming harmful or hazardous levels of alcohol (13%).
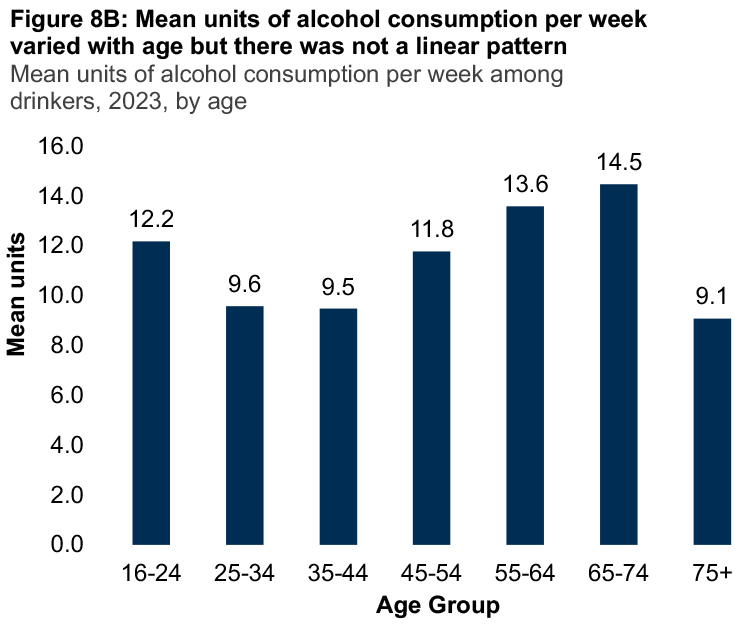
A similar pattern was evident in the mean units of alcohol consumed per week, which was highest among those aged 65-74 and 55-64 (14.5 and 13.6 units respectively). Figures for mean units consumed was lowest for those aged 75+ (9.1 units) followed by 25-34 year olds (9.6 units).
Similar to previous years, males reported higher levels of hazardous or harmful drinking than females across all age groups. The largest difference between males and females was recorded for the 65-74 age group with proportions of 37% and 17% respectively.
8.2.3 The proportion of adults with an AUDIT score of eight or more has been broadly consistent across the timeseries
The Alcohol Use Disorders Identification Test (AUDIT) score is used to determine alcohol dependency or high risk use. With the exception of 2021 (14%), the proportion of adults with an AUDIT score of eight or more (hazardous/ harmful drinking or possible alcohol dependency) has remained in the range 17% - 19% (18% in 2023). The proportion with an AUDIT score of 8 or more varied significantly by sex in 2023, 24% among men and 13% among women.
Across the timeseries, the proportion of adults with an AUDIT score of 16 or more, indicative of harmful drinking or possible alcohol dependence, has been in the range <1% - 3%. Table 8.3
8.2.4 Adults aged 16-24 were most likely to record an AUDIT score of eight or more
The proportion of adults with an AUDIT score of 8 or more decreased with age, from 31% among those aged 16-24 to 5% among those aged 75 and over. Similar patterns by age were recorded for both males and females.
8.2.5 Adults living in the most deprived areas of Scotland were more likely to record an AUDIT score of eight or more
The proportion of adults with an AUDIT score of eight or more varied by area deprivation, from 12%-18% among adults living in the three least deprived quintiles in Scotland to 21%-23% among those living in the two most deprived quintiles in Scotland. This trend was driven by males, with no significant differences by deprivation in the proportion of females with an AUDIT score of eight or more.
The proportion of males living in the most deprived areas who recorded an AUDIT score of 8 or more was over twice as high as the proportion of females (32% and 12% respectively). Table 8.5
8.2.6 Adults with an AUDIT score of eight or more had lower levels of mental wellbeing
Adults who were low risk drinkers or abstinent (AUDIT score of 0-7) recorded higher mental wellbeing than those who had an AUDIT score of 8+ (mean WEMWBS scores of 49.4 and 47.7 respectively).
Males who had an AUDIT score of 8+ reported higher levels of mental wellbeing than females (mean WEMWBS scores of 48.0 and 47.2 respectively).
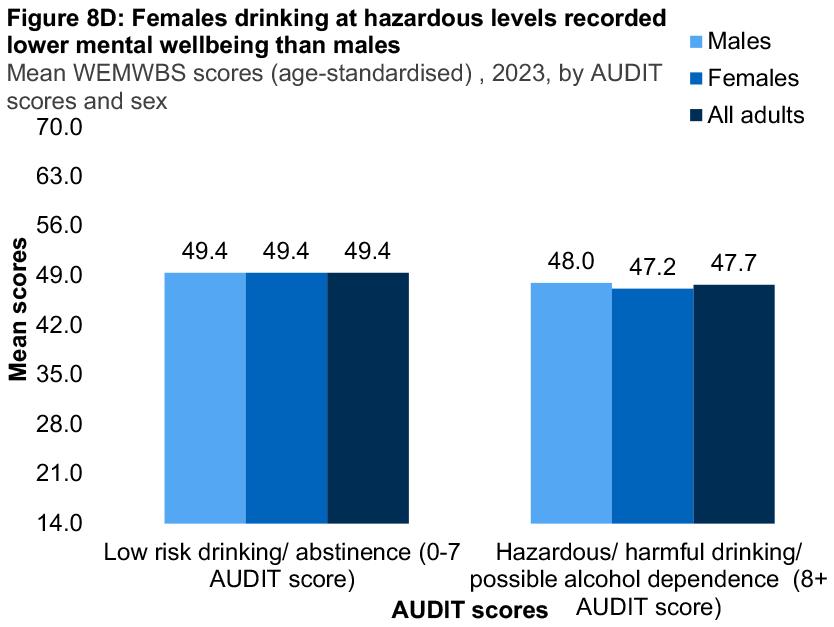
Note: WEMWBS scores range from 14 to 70. Higher scores indicate greater wellbeing.
8.2.7 Adult drug use in the last 12 months declined with age, most notably for Class B drugs
In 2023, 14% of all adults had used any of the drugs listed in the survey in the previous 12 months; with higher prevalence among males (18%) compared with females (11%).
Reported drug use among adults during the last 12 months decreased with age in 2023, from 26%-27% of those aged 16-34 to 4%-6% of those aged 65 and over.
In 2023, 6% of adults had used Class A drugs in the last year, 10% had used Class B drugs, and 1% had used Class C drugs. Males were more likely than females to have used Class B drugs in the last year (12% compared with 8%).
More than one in ten (13%) of those aged 16-24 had used a Class A drug in the last year compared with 1% of those aged 75 and over. The largest variation with age was recorded for Class B drugs, with 22% of those aged 16-24 having taken Class B drugs in the last 12 months compared with 1% of those aged over 75.
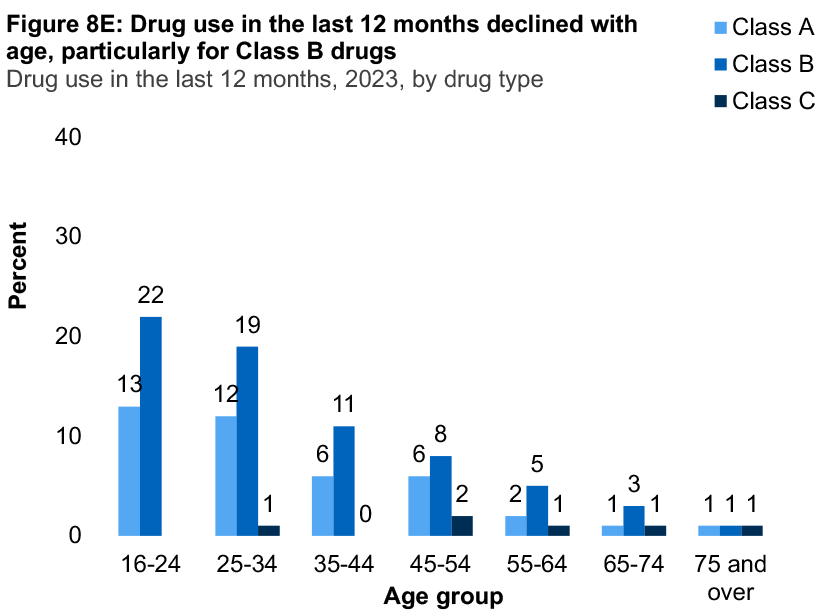
In 2023, the drug most commonly used in the 12 months prior to being interviewed was cannabis (9%). A higher proportion of males reported having used cannabis in the last year compared with females (11% compared with 7%), as did those aged 16-34 (18% - 21%) compared with those aged 75 and over (<1%).
8.2.8 No clear patterns were evident in relation to prevalence of drugs use by area deprivation and sex
In 2023, there were no significant variations with regards to the adult prevalence of any drug use in the past 12 months by area deprivation.
Table 8.8
8.2.9 Adults who had used any drug in the last 12 months had lower mental wellbeing than non-drug users
In 2023, adults who had used any drug in the last 12 months reported lower mental wellbeing than those who had not used drugs (mean WEBWBS scores of 46.3 and 49.4 respectively).
Similar patterns were recorded among males (46.6 and 49.6 respectively) and females (45.8 and 49.2 respectively).
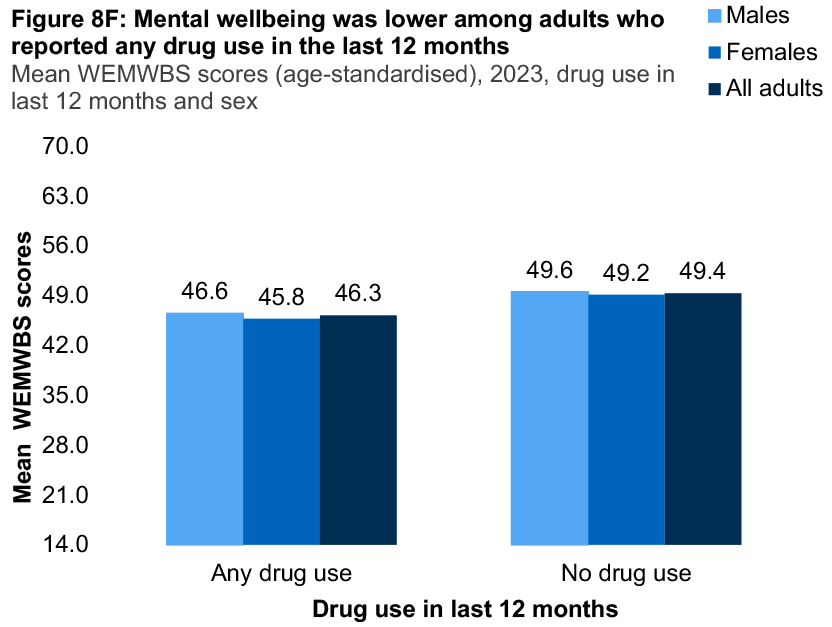
Note: WEMWBS scores range from 14 to 70. Higher scores indicate greater wellbeing.
8.2.10 Males were more likely than females to report ever having had a problem with alcohol
Just under one in ten adults reported ever having had a problem with alcohol in 2023 (9%), a proportion that was higher among males (11%) than females (7%). This proportion was relatively consistent across age groups (8%-11%) with the exception of those aged 75 and over where this fell to 3%.
Three per cent of adults reported ever having had a problem with drug use. Self-reported problem drug use was higher among those aged 25-54 (5%) compared with the other age groups (<1% - 2%), as well as among males (4%) compared with females (2%). Table 8.10
Notes
- Non-drinker: no alcohol units per week; Moderate drinker: >0 units and up to 14 units; Hazardous/harmful drinker: more than 14 units.
- WEMWBS scores range from 14 to 70. Higher scores indicate greater mental wellbeing. Mean WEMWBS score is part of the national mental health indicator set for adults.
- For a list of drugs included in the survey, see the questionnaire appended to the 2023 technical report.
- Some caution should be exercised when interpreting data for 2021 within any time series data presented due to some methodological changes during the pandemic. Please see the 2022 Scottish Health Survey technical report for more information.
- Age-standardised data has been presented in sections 8.2.5, 8.2.6, 8.2.8 and 8.2.9.
Table list
Table 8.1 Estimated usual weekly alcohol consumption level, 2003 to 2023, by sex
Table 8.2 Estimated usual weekly alcohol consumption level, 2023, by age and sex
Table 8.3 AUDIT scores, 2012 to 2023, by sex
Table 8.4 AUDIT scores, 2023, by age and sex
Table 8.5 AUDIT scores (age-standardised), 2023, by area deprivation and sex
Table 8.6 Adult WEMWBS mean score (age-standardised), 2023, by AUDIT scores
Table 8.7 Adult drug use in the last 12 months by drug type, 2023, by age and sex
Table 8.8 Adult drug use in the last 12 months by drug type (age-standardised), 2023, by area deprivation and sex
Table 8.9 Adult WEMWBS mean score (age-standardised), 2023, by drug use and sex
Table 8.10 Previous and current problem with alcohol and drug use, 2023, by age and sex
References and notes
1 World Health Organization (2022) Alcohol. Available at: https://www.who.int/news-room/fact-sheets/detail/alcohol
2 Alcohol-specific deaths | National Records of Scotland (nrscotland.gov.uk)
3 National Records of Scotland (2023) Drug-related Deaths in Scotland in 2023 [Online]. Available at: Drug-related deaths in Scotland in 2023: Report (nrscotland.gov.uk)
4 Katikireddi SV, Whitley E, Lewsey J, Gray L and Leyland AH (2017). Socioeconomic status as an effect modifier of alcohol consumption and harm: analysis of linked cohort data. Lancet Public Health; 2: 267–76. Available at: https://www.thelancet.com/journals/lanpub/article/PIIS2468-2667(17)30078-6/fulltext
5 Scottish Government. (2018). Alcohol Framework 2018: Preventing Harm. Available at: https://www.gov.scot/publications/alcohol-framework-2018-preventing-harm-next-steps-changing-relationship-alcohol/
6 World Health Organization (2018) The SAFER initiative: A world free from alcohol related harm. Available at: https://www.who.int/initiatives/SAFER
8 Scottish Government (2022). National Drugs Mission Plan: 2022-2026. Available at: https://www.gov.scot/publications/national-drugs-mission-plan-2022-2026/
9 See: https://digital.nhs.uk/data-and-information/publications/statistical/health-survey-for-england
10 See: https://www.nisra.gov.uk/statistics/find-your-survey/health-survey-northern-ireland
11 See: https://www.gov.wales/national-survey-wales
12 See: https://www.crimesurvey.co.uk/en/index.html
13 See: https://www.health-ni.gov.uk/articles/drug-prevalence-survey
Contact
There is a problem
Thanks for your feedback