The Scottish Health Survey 2023 - volume 1: main report
This report presents results for the Scottish Health Survey 2023, providing information on the health and factors relating to health of people living in Scotland.
9 Obesity
Rory McClelland
9.1 Introduction
Obesity is classified as having a Body Mass Index (BMI) of 30 kg/m2 or more [147].
It is described by the World Health Organisation as a complex multifactorial chronic non-communicable disease (NCD) characterised by excess adiposity that can have a detrimental effect on health[148].
Obesity is linked to a range of health outcomes including type 2 diabetes, cardiovascular disease (CVD), hypertension, asthma and high cholesterol, having the potential to worsen existing conditions and/or to lead to new ones developing[149],[150],[151]. Research has also shown that more than 1 in 20 adult cancer cases in the UK are linked to excess weight making obesity possibly the second largest preventable cause of cancer[152].
Studies have indicated that there is an association between living with obesity and mental health issues such as depression, anxiety, disordered eating, low self-esteem and reduced quality of life[153]. There is also evidence of a link between living with overweight and obesity in midlife and increased risk of dementia or Alzheimer’s disease in later life[154]. The evidence also suggests that younger people in the UK are living with a higher BMI at an earlier age and staying at that higher BMI for longer[155]. Living with obesity at a young age tends to continue into adulthood and places individuals at increased risk of developing conditions such as CVD and diabetes at a younger age[156].
9.1.1 Policy background
Maintaining a healthy weight is a key public health priority for Scotland. A Healthier Future: Scotland’s Diet and Healthy Weight Delivery Plan1 published in July 2018, sets out a vision where everyone has a healthy weight, including:
- Children have the best start in life – they eat well and have a healthy weight, including seeking to halve the prevalence of child obesity by 2030.
- People have access to effective weight management services.
- Leaders across all sectors promote healthy weight and diet.
- Diet-related health inequalities are reduced.
These outcomes are supported by a wide range of actions, including those highlighted at the Diet chapter to improve the food environment. Scottish Government also provides funding to health boards to deliver adult and children’s weight management services, in line with the Public Health Scotland national standards[157], and the Type 2 Diabetes Prevention Framework[158].
9.1.2 Reporting on obesity in the Scottish Health Survey
This chapter presents data on:
- body mass index (BMI)[159] for adults and children
- health risk categories associated with overweight and obesity for adults
Figures are reported by age and sex.
For definitions of terminology used in this chapter and for further details on the data collection methods for BMI and health risk categories, please refer to Chapter 2 of the Scottish Health Survey 2023 volume 2 technical report.
Please note that some caution should be exercised when interpreting data for 2021 within any time series data presented due to some methodological changes during the pandemic. Please see the 2022 Scottish Health Survey technical report for more information.
9.1.3 Comparability with other UK statistics
The Health Survey for England [160], Health Survey Northern Ireland[161] and the National Survey for Wales[162] provide estimates of adult obesity prevalence in the other UK countries. These surveys are conducted separately and have different sampling methodologies, so adult obesity prevalence estimates across the surveys are only partially comparable.
The Health Survey for England and the Health Survey Northern Ireland provide estimates of child obesity prevalence in England and Northern Ireland. These surveys are conducted separately and have different sampling methodologies, so child obesity prevalence estimates across the surveys are only partially comparable.
9.2 Results
Summary points
In 2023:
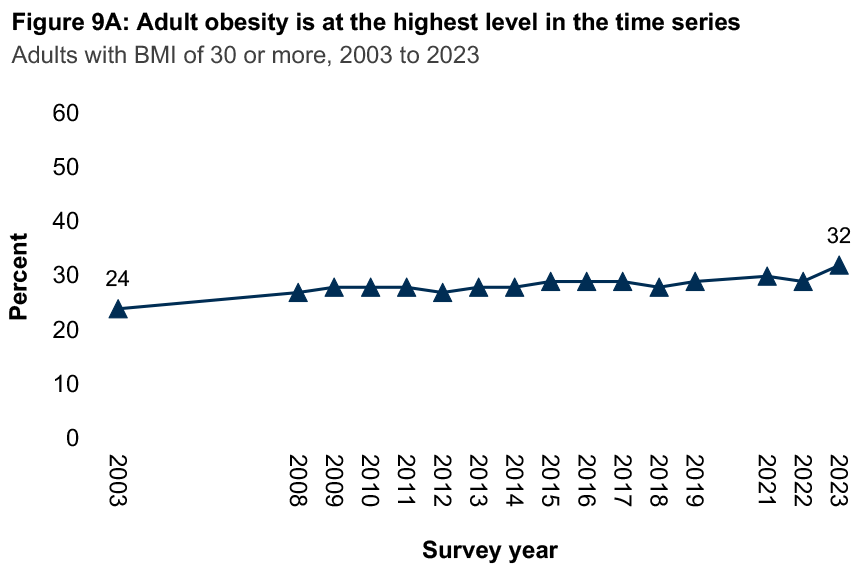
- Almost a third of adults (32%) were living with obesity, the highest level in the time series
- The mean adult BMI was 28 kg/m2, the same as in 2021 and 2022, following an increase from 27.1 g/m2 in 2003.
- Adults aged 16-24 were more likely than older adults to be in the healthy weight range (57%).
- Almost seven in ten children were within a healthy weight range (68%) based on their BMI, this was within the range of 64% - 72% recorded since 1998.
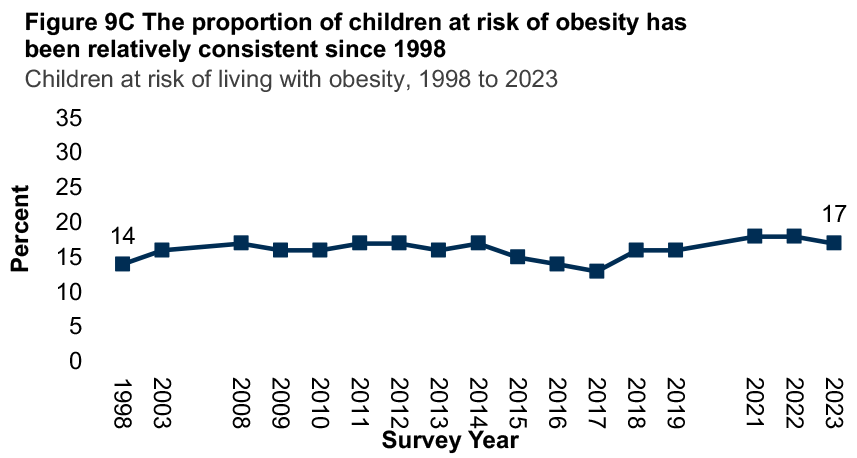
- Just under a fifth of children (17%) were at risk of obesity, a proportion that has remained in the range 13% - 18% since 1998.
In 2022/2023 combined:
- Just under two-thirds of adults had at least an increased health risk based on their BMI and waist circumference (64%).
9.2.1 Adult obesity is at the highest level in the time series
In 2023, almost a third of adults (32%) were living with obesity, the highest level in the time series and an increase from 24% in 2003.
Two-thirds (66%) of adults were classed as living with overweight (including obesity). This proportion has been relatively stable since 2008 (64% - 67%).
In 2023, the mean BMI for adults was 28.0kg/m2, with no significant difference by sex. The 2023 figure remains the same as in 2021 and 2022, following an increase from 27.1 g/m2 in 2003.

9.2.2 Healthy weight was highest for adults aged 16-24
Fifty-seven per cent of younger adults aged 16-24 were in the healthy weight range in 2023, compared to 23% - 39% of other age groups.
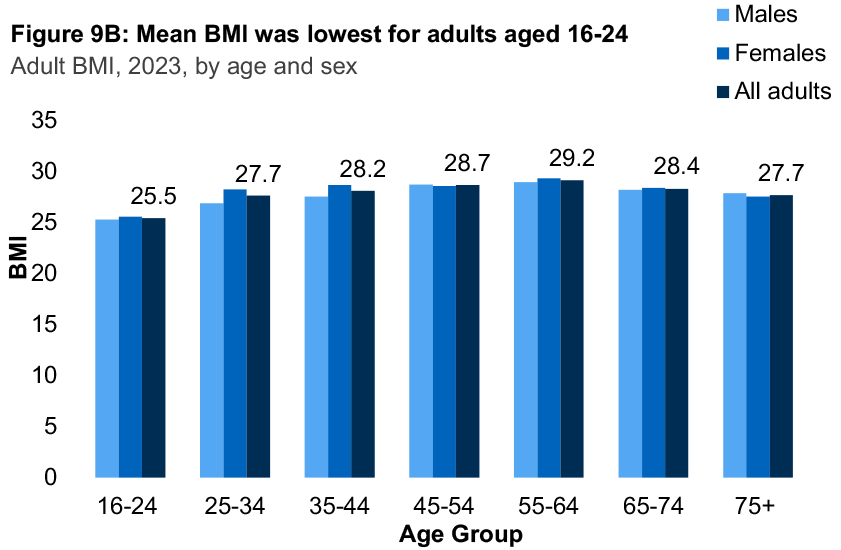
Younger adults aged 16-24 recorded a mean BMI of 25.5 kg/m2 in 2023, a lower mean than the range recorded for adults aged 25 or older (27.7 kg/m2 – 29.2 kg/m2). This pattern was evident for both males and females.

9.2.3 Increased health risk based on BMI and waist circumference peaked among the 55-64 age group in 2022/2023 combined
In 2022/2023 combined, just under two-thirds of adults had at least an increased health risk based on their BMI and waist circumference (64%), a proportion that was higher among females (64%) compared with males (58%).
Among all adults in 2022/2023, the prevalence of increased health risk varied by age with the lowest proportion recorded among those aged 16-24 (27%) while the highest was recorded among adults aged 55-64 (78%). Table 9.3
9.2.4 Almost seven in ten children were within the healthy weight range in 2023
In 2023, 68% of children were within a healthy weight range based on their BMI. This proportion has been in the range 64% - 72% since 1998.
Just under a fifth of children (17%) were at risk of obesity, a proportion that has remained in the range 13% - 18% since 1998. Thirty per cent of children were at risk of overweight (including obesity).

9.2.5 No significant variation was recorded by age or sex in the proportion of children in the healthy weight range
In 2023, females were more likely to record a BMI within the healthy range than males (70% and 66% respectively), but this difference was not significant.
No significant variations were evident by BMI category when analysed by age in 2023. Table 9.5
Notes
- For 2021, height and weight measurements were self-reported and then adjusted according to formulae developed by Public Health England for use on the Active Lives survey from Health Survey for England data. The formulae have the effect of increasing self-reported weight and decreasing self-reported height, particularly among older adults. A proportion of measurements in 2022 and a much smaller proportion in 2023 were self-reported also.
- Percentages for adult health risk category are based on those who have a valid measurement for waist circumference, in addition to valid measurements of height and weight. Therefore, subtotals for BMI categories by age and sex in this table are not definitive.
Table list
Table 9.1 Adult BMI, 2003 to 2023, by sex
Table 9.2 Adult BMI, 2023, by age and sex
Table 9.3 Health risk category associated with overweight and obesity based on BMI and waist circumference, 2022/2023 combined, by age and sex
Table 9.4 Children BMI, 1998 to 2023, by sex
Table 9.5 Children BMI, 2023, by age and sex
References and notes
1 A Healthier Future: Scotland’s Diet & Healthy Weight Delivery Plan, Edinburgh:
Scottish Government, (2018). Available at: http://www.gov.scot/Publications/2018/07/8833
2 World Obesity Federation. Available at: https://s3-eu-west-1.amazonaws.com/wof-files/Weight_Stigma_Briefing_FINAL.pdf
3 Defined in adults as a body mass index (BMI) of 30 kg/m² or greater.
4 Abdelaal M, le Roux, C and Docherty, N (2017). Morbidity and mortality associated with obesity. Annals of Translational Medicine; 5(7): 101: p.1. Available at: https://www.ncbi.nlm.nih.gov/pmc/articles/PMC5401682/
5 Safei, M, Sundararajan, EA, Driss, M, Boulila, W and Shapi’i, A. (2021). A systematic literature review on obesity: Understanding the causes and consequences of obesity and reviewing various machine learning approaches used to predict obesity. Computers in Biology and Medicine, 136 (2021) [Online]. Available at: https://www.sciencedirect.com/science/article/pii/S0010482521005485
6 Brown, KF et al. (2018). The fraction of cancer attributable to modifiable risk factors in England, Wales, Scotland, Northern Ireland, and the United Kingdom in 2015. Br. J. Cancer 118, 1130–1141. Available at: https://www.nature.com/articles/s41416-018-0029-6
7 Sarwer, DB and Polonsky, HM. (2016). The Psychosocial Burden of Obesity. Endocrinology and Metabolism Clinics of North America, Vol 45(3), pp. 677-688. Available at: https://www.ncbi.nlm.nih.gov/pmc/articles/PMC6052856/pdf/nihms980694.pdf
8 Flores-Cordero, JA, Perez-Perez, A, Jiminez-Cortegana, C, Alba, G, Flores-Barragan, A and Sanchez-Margalet. (2022). Obesity as Risk Factor for Dementia and Alzheimer’s Disease: The Role of Leptin. International Journal of Molecular Sciences, Vol 23(9) [Online]. Available at: https://www.ncbi.nlm.nih.gov/pmc/articles/PMC9099768/
9 Johnson, W, Li, L, Kuh, D, Hardy, R (2015). How Has the Age-Related Process of Overweight or Obesity Development Changed over Time? Coordinated Analyses of Individual Participant Data from Five United Kingdom Birth Cohorts. PLoS Med 12(5). Available at: https://pubmed.ncbi.nlm.nih.gov/25993005/
10 Balasundarem, P and Krishna, S. (2023). Obesity Effects on Child Health. National Center for Biotechnology Information [Online]. Available at: https://www.ncbi.nlm.nih.gov/books/NBK570613/
12 A Healthier Future: type 2 Diabetes prevention, early detection and intervention: framework - gov.scot (www.gov.scot)
13 Data for 2022 are based on interviewer-administered measurements only for children. For adults in 2022, both self-reported and interviewer administered height and weight measurements were combined. Self-reported height and weight measurements were adjusted according to formulae developed by Public Health England for use on the Active Lives survey from Health Survey for England data. The formulae have the effect of increasing self-reported weight and decreasing self-reported height, particularly among older adults. In 2021, the telephone format of the survey meant that all adult and child measurements were self-reported. The measurements for adults were adjusted as described above. No equivalent adjustment factors were available for children and hence the analysis for children in 2021 was based on self-reported measures. Therefore, caution should be taken when comparing data with the 2021 and 2022 surveys. Available at: https://consult.gov.scot/population-health/restriction-promotion-of-food-and-drink-proposed/
14 See: https://digital.nhs.uk/data-and-information/publications/statistical/health-survey-for-england
15 See: https://www.nisra.gov.uk/statistics/find-your-survey/health-survey-northern-ireland
Contact
There is a problem
Thanks for your feedback