Social capital and community wellbeing in Scotland
This report provides information about the extent and nature of social connections and social capital in Scotland from 2018/2019 - 2022. It draws on a range of data, from both the Scottish Household Survey and qualitative research, to explore social capital in Scotland.
3: The distribution of social capital across geographies and population subgroups
Trends at the national level are useful for summarising what is happening overall in society. However, they mask differences between communities, geographies, and subgroups of the population.
This section of the report looks at how social capital varies across different geographies and population subgroups, including factors such as where we live, disability, age, sex and ethnicity. It focuses on important variations for different groups, acoss some key social capital measures[38] – (full tables of all the breakdowns can be found in Annex B and accompanying excel workbooks).
Where we live – geographical variations
There are large differences in measures of social capital depending on where people live. This includes differences in more and less deprived areas, between local authorities, and between urban and rural settings.
Local Authorities
Social capital varies between local authorities. There is less variation in how people rate their neighbourhood. The majority of people rate their neighbourhoods as a ‘good’ or ‘very good’ place to live – across all of Scotland’s local authorities.
Neighbourhood ratings are highest in the local authorities in the North East, the islands of Orkney, Shetland and Na-h Eileanan Siar, alongside East Renfrewshire and Clackmannanshire (shaded in dark blue, Figure 5).
There are larger differences between local authorities on whether people ‘strongly’ or ‘tend to agree’ there are places to meet and socialise in their neighbourhoods. This ranges from 35% of people in South Ayrshire, up to 79% in East Renfrewshire. Agreement is generally higher around the middle of Scotland, South East and the islands of Orkney and Shetland (Figure 6).
Levels of loneliness also vary widely by local authority, from 1 in 10 people (10%) in East Dunbartonshire feeling lonely ‘some, most or almost all of the time’, up to 40% in North Ayrshire. High levels of loneliness were also reported in Fife (36%) and Dundee City (34%) (shaded in light blue, Figure 7).
“Urban life can be anonymous and isolating. Humans are social animals and thrive on interaction.” (Respondent from the free text survey reflecting on how taking part in cultural activities makes them feel, 2024)
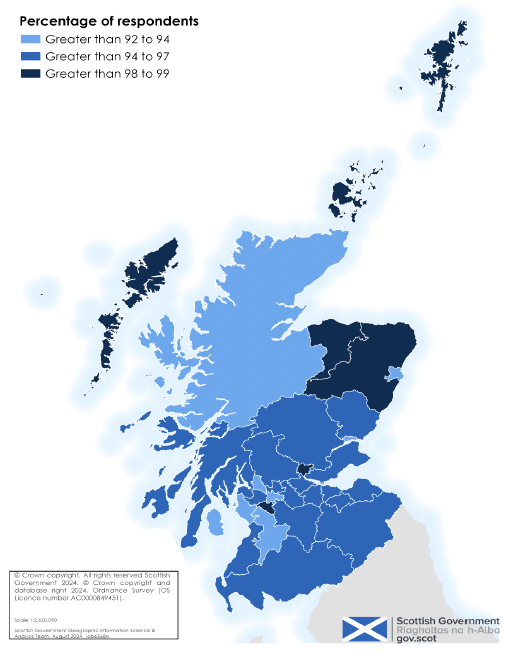
Percentage of adults who rate their neighbourhood as a ‘very’ or ‘fairly’ good place to live, 2022, Local Authority Areas in Scotland[39]
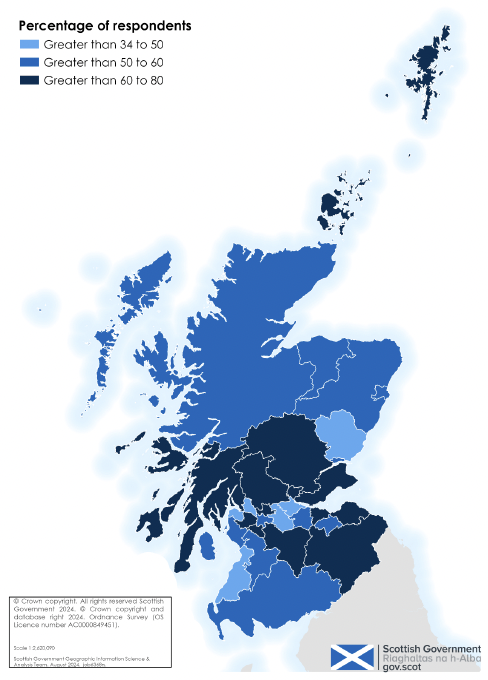
Percentage of adults who ‘agreed’ or ‘strongly agreed’ there are places to meet and socialise, 2022, Local Authority Areas in Scotland[40]
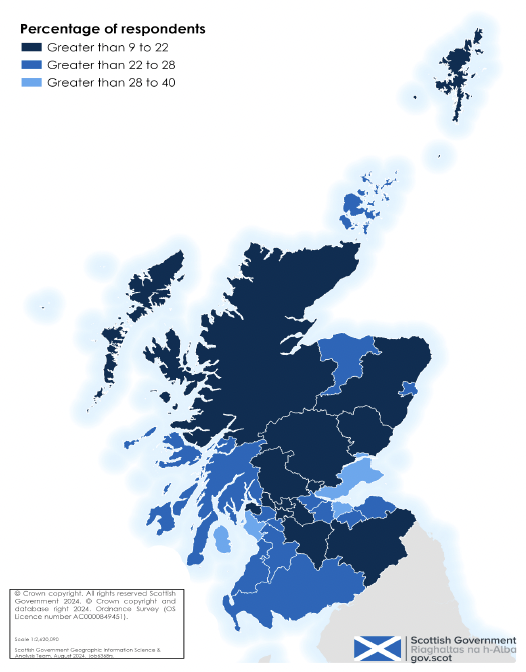
Percentage of adults who experienced loneliness in the last week ‘all or almost all of the time’, ‘some of the time’, ‘most of the time’, 2022, Local Authority Areas in Scotland[41]
There are high levels of social capital in the islands – and challenges in the entirely urban local authorities
People living in Orkney, Shetland and Na-h Eileanan Siar consistently have higher ratings on a range of social capital measures.
In contrast, the entirely urban local authorities of Glasgow City, Aberdeen City and Dundee have lower ratings on several measures.
The City of Edinburgh, which is also entirely urban, is more mixed. Sixty-six per cent agree there are welcoming places and opportunities to meet new people (higher than the Scotland average of 53%), and 79% meet others socially at least once a week. However, only 75% can count on neighbours to keep an eye on their home (compared to 87% in Scotland overall).
Levels of deprivation[42] may explain some of the differences in social capital between local authorities (along with differences between rural and more urban settings). However, this is not a clear relationship. There is variation between local authorities with similar levels of deprivation.
Inverclyde, the local authority with the highest levels of deprivation in Scotland, also has the highest amount (94%) of people who feel a ‘very’ or ‘fairly strong’ sense of belonging to their community (the Scotland average is 83%). In Glasgow City, which has similar levels of deprivation, 79% feel a very or fairly strong sense of belonging (Figure 8).
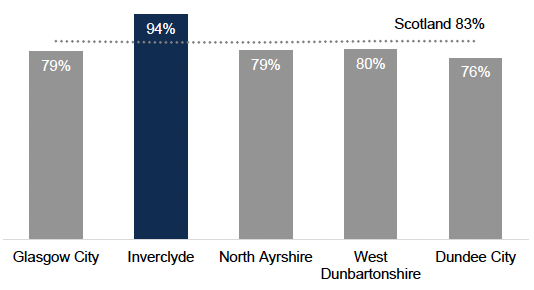
Percentage of adults who feel a ‘very’ or ‘fairly’ strong sense of belonging to their community, by the five local authorities in Scotland with the highest levels of deprivation, 2022, Local Authorities in Scotland
The findings suggest that there are additional factors, beyond levels of deprivation in a local authority, that explain variation in social capital. This may include, for instance, urban-rural differences [See Urban Rural Section], or differences in the people who live in an area (such as age [See Age Section]).
This variation between places also needs to be understood with reference to wider factors including the social and economic history of places.[43]
Deprivation
Levels of deprivation can vary considerably within local authorities. The Scottish Index of Multiple Deprivation (SIMD) can be used to identify deprived neighbourhoods at a smaller, more local level. The SIMD is a relative measure of deprivation across 6,976 small areas (called data zones) in Scotland.[44] Some of the indicators of deprivation that define SIMD are related to social capital related concepts such as neighbourhood quality, accessibility and safety. This should be considered when reading the following section.
There are lower levels of social capital in more deprived areas
There are differences across every measure of social capital for people living in the least and most deprived areas of Scotland (see Table 1, Table 2 and Table 3 in Annex B).
Some of the differences are particularly large. As noted in Figure 9, people living in the most deprived areas are much less likely, than those in the least deprived areas, to agree that local people take action to improve the area (43%, compared to 76% in the least deprived areas).
Adults living in the most deprived areas are also less likely to agree that people in their neighbourhoods can be trusted (64%, compared to 91% in the least deprived areas), and that there are welcoming places and opportunities to meet people (43%, compared to 64% in the least deprived areas). There are also large differences in how safe people feel in their neighbourhoods (68%, compared to 89% in the least deprived areas).
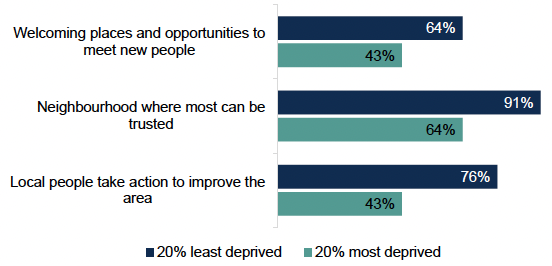
Percentage of adults who agree ‘there are welcoming places and opportunities to meet new people’, ‘this is a neighbourhood where most can be trusted’, and ‘where local people take action to improve the area’ by SIMD, 2022, Scotland
The relationship is often linear across each SIMD quintile. For example, as deprivation goes down, ratings of neighbourhoods as a ‘very good’ place to live go up (see Figure 10).
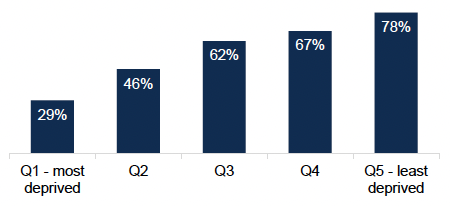
Percentage of adults who rate their neighbourhood as a 'very good' place to live by SIMD, 2022, Scotland
Loneliness increases with deprivation (alongside other groups such as disabled people and adults aged over 75 – see Disability and Age Sections).
People living in the most deprived areas are almost twice as likely to experience loneliness (30% of adults felt lonely some, most or almost all of the time, compared to 16% in the least deprived areas) (Figure 11).
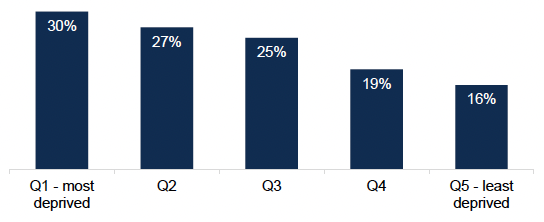
Percentage of adults who feel lonely at least 'some', 'most', 'all or almost all' of the time' in the past week by SIMD, 2022, Scotland
Levels of social interaction do not follow the same pattern. Seventy-three per cent of people met friends, relatives, neighbours or work colleagues at least once a week in the least deprived areas, slightly higher than 69% of people in the most deprived areas – and there is not a lot of variation between levels of social interaction and deprivation quintiles (Figure 12).
This finding may not be surprising, as social isolation is different to loneliness. Previous evidence has shown that loneliness and social interaction are related but different concepts.[45] It is possible to experience loneliness and high levels of social interaction, and this is also true in the opposite direction. You may have low levels of social interaction and not experience any feelings of loneliness.
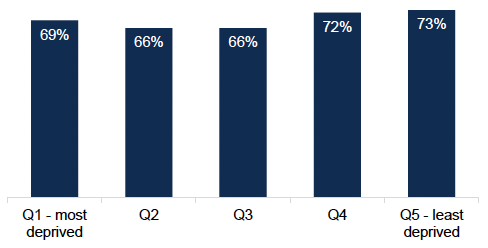
Percentage of adults who report meeting others socially at least once a week by SIMD, 2022, Scotland
People living in more deprived areas were less likely to volunteer than those from less deprived areas.
Fifty-one percent of respondents living in the 20% least deprived areas had volunteered (either formally or informally), compared with 37% of those living in the 20% most deprived areas.
A similar pattern was seen for formal volunteering where 14% of respondents in the most deprived areas said they had done formal volunteering compared to 27% of respondents living in the least deprived areas.
Urban and Rural areas
Social capital tends to be higher in rural areas and lower in urban settings.
People living in rural areas (particularly remote rural areas) score consistently higher across most measures than those living in more urban settings (see accompanying Excel workbooks). This is often higher than the Scotland average.
Within the urban and rural classifications[46], places with the lowest levels of social capital, by these measures, are often the areas that are classified as ‘large urban’ (settlements with more than 125,000 people) and ‘other urban’ (settlements with between 10,000 and 124,999 people).
For instance, 75% of people in large urban areas could turn to someone in their neighbourhood for advice. This compares to 92% of people in remote rural areas. Sixty-eight per cent of people in remote rural areas agree there are places to meet and socialise locally, compared to 52% in other urban areas, and 56% in large urban areas.
However, people in large urban areas meet socially just as often as those living in remote rural areas
Seventy-three per cent of people in large urban areas, meet friends, relatives, neighbours and work colleagues at least once a week. This is similar to 74% of people in remote rural areas, compared to 64% in accessible rural areas and 66% in accessible small towns.
There are other measures where people in certain urban settings score highly. People in remote small towns are most likely (of all urban-rural settings) to say they would help a neighbour (98%), and most likely to have done any type of volunteering in the past 12 months (63%). People in accessible small towns are most likely (alongside remote rural) to agree there are welcoming places and opportunities to meet new people (60% in both).
Volunteering is lowest in large urban areas
The largest differences by urban-rural settings are seen in the Social Participation and Community Empowerment themes. Volunteering is lowest in large urban areas (Figure 13). Thirty-nine per cent of people in large urban areas have done some type of volunteering (either formally or informally) in the past 12 months, compared to 63% of people in remote small towns.
“Our whole community is held together by volunteer effort... I have to go outwith the community to find events that I can simply go along to and enjoy without having to set up furniture, clear up, serve teas etc.” (Respondent from the free-text survey, based in the Highlands, describing how they take part in different cultural or creative activities, 2024)
There is also a gap in formal volunteering. Eighteen per cent of people in large urban areas have formally volunteered in the past 12 months, compared to 33% in remote rural areas.
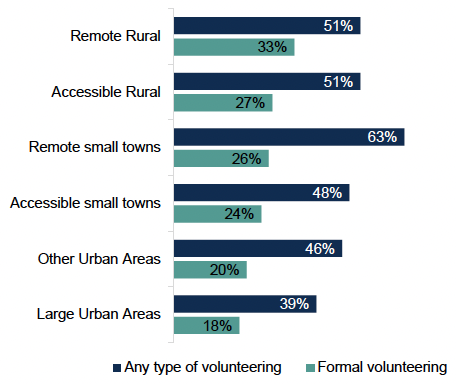
Percentage of adults who have volunteered formally, or taken part in any type of volunteering (formal or informal), in the past 12 months by six-fold Urban Rural Classification, 2022, Scotland
People in remote rural areas are also much more likely to feel people take action to improve their communities
Eighty-one per cent of people in remote rural areas agree that people take action to improve the local neighbourhood, compared to 58% of people in other urban areas, and 59% in large urban areas (Figure 14).
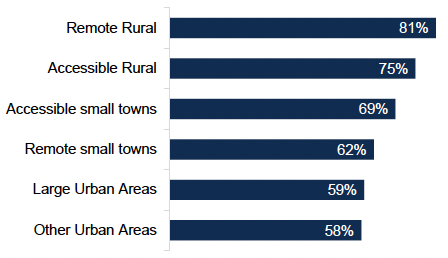
Percentage of adults who agree that local people take action to improve the neighbourhood by six-fold Urban Rural Classification, 2022, Scotland
“My parents, where they live, they have neighbours’ keys and know everyone’s name. I now live in the city in a block of flats with so many other people and I couldn’t tell you any of their names.” (People’s Panel member, refelcting on what their community is like, 2022)
“If you live in [name of island] you have to rely on the community as there aren’t that many services. (People’s Panel member, refelcting on what their community is like, 2022)
Population subgroup variations
Disability
There is a gap between disabled and non-disabled people across every measure of social capital (see Table 4 in Annex B).
Disabled people feel less safe in their neighbourhoods
Sixty-six per cent of disabled people felt safe walking home alone after dark, compared to 87% of non-disabled people (Figure 15).
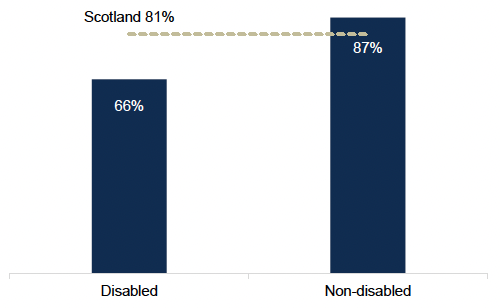
Percentage of adults who feel 'very' or 'fairly' safe walking alone in their neighbourhoods after dark by disability, 2022, Scotland
Loneliness and social isolation are higher in disabled people
Disabled people are more than twice as likely to be lonely compared to non-disabled people. Forty per cent of disabled people (compared to 17% of non-disabled people) report feeling lonely some, most, almost all, or all of the time in the past week (Figure 16).
Disabled people are also more socially isolated. Sixty-three per cent of disabled people met others socially at least once a week, compared to 71% of non-disabled people (Figure 16).
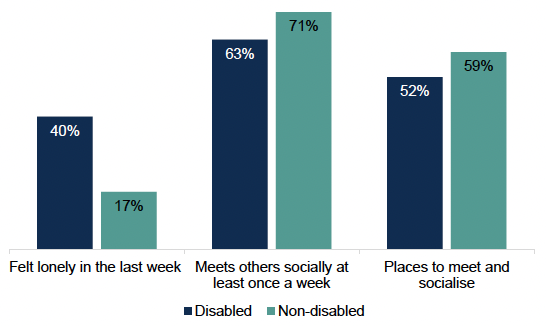
Percentage of adults who feel lonely 'some', 'most', 'all or almost all' of the time in the past week, who meet others socially at least once a week, and who agree there are places to meet and socialise by disability, 2022, Scotland.
Disabled people are less likely to agree that there are places to meet and socialise in their community, with 52% agreeing compared to 59% of non-disabled people. They are also less likely to agree that there are welcoming places to meet new people (47% compared to 55%). Large differences were also seen for neighbourhood trust, with 75% of disabled adults and 85% of non-disabled adults agreeing that they live in a neighbourhood where most people can be trusted.
“We are currently locked up. What about the damage to disabled people who are still locked up. If numbers [of COVID infections] could be cut in half it would be easier to manage that risk, you could get out again to do things that keep us sane.” (People’s Panel member, talking about their pandemic experiences, 2022)
Disabled adults were less likely to say they had undertaken volunteering in the last 12 months
Forty-three per cent of disabled adults participated in any type of volunteering (formal or informal) in the past 12 months compared to 46% of those with no disability. Disabled adults were also less likely than non-disabled adults to volunteer formally (17% and 3% respectively).
Age
The sense of belonging and trust within the community increased with age, showing significant improvement among those aged 60 and above (Figure 17). In 2022, 80% of those aged 16 to 24 reported a ‘very’ or ‘fairly’ strong feeling of belonging to their local community, compared to 87% of those aged 60-74 and 90% of those aged 75 and over. Strong trust in the neighbourhood community was experienced by 75% of those aged 16 to 24, compared to 88% of those aged 60 to 74 and 90% of those aged 75 and over.
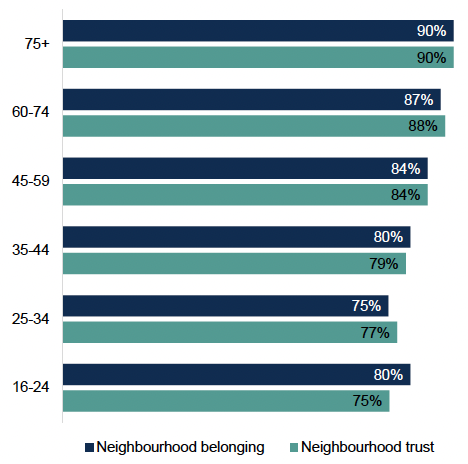
Percentage of adults who feel a 'very' or 'fairly' strong sense of belonging to their community and who agree with the statement that ‘this is a neighbourhood where most people can be trusted’ by age, 2022, Scotland
The remaining aspects of Community Cohesion, such as the diversity of backgrounds, the availability of local places to meet up and socialise, and welcoming places and opportunities to meet new people, were fairly consistent across all age groups and aligned with the Scotland average.
In terms of the quality of social networks, people aged 75 and over were the least likely to feel safe walking alone in their neighbourhood after dark (63% felt very or fairly safe). Moreover, they reported significantly higher levels of loneliness compared to all other age groups, with 29% feeling lonely some, most, or almost all of the time, compared to 23% in Scotland overall. Loneliness is also high for 16 to 24 year olds (25%) (Figure 18).
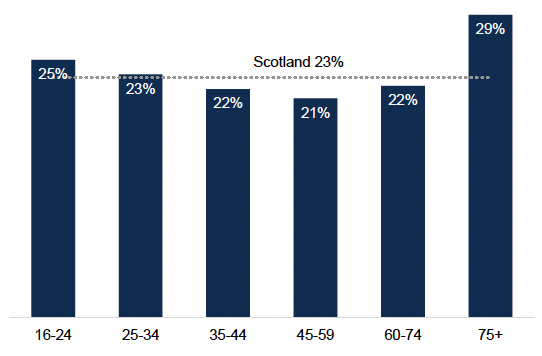
Percentage of adults who have felt lonely 'some', 'most', 'all or almost all' of the time within the last week by age group compared to the national average, 2022, Scotland
Despite these challenges, both the oldest group (75 and over) and the youngest group (16-24) had the highest levels of social interaction, with 73% and 82%, respectively, meeting socially at least once a week (Figure 19).
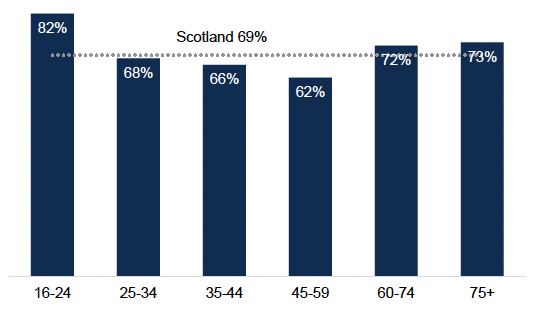
Percentage of adults who meet socially with friends, relatives, neighbours or work colleagues at least once a week by age group compared to the national average, 2022, Scotland
While positive experiences of neighbourhood support were high across all age groups, they were more frequently reported by people aged 45 and over, with these experiences improving with age.
Among those aged 16-24, 81% could rely on someone in their neighbourhood for help if needed, 81% could count on someone to keep an eye on their home, and 74% could turn to someone for advice or support. Among those aged 45-54, these figures rose to 88%, 89%, and 83%, respectively. For those aged 75 and over, the figures were even higher, with 93% being able to rely on someone for help, 93% able to count on someone to watch their home, and 86% able to seek advice or support.
The willingness to help neighbours in emergencies, particularly those who might struggle to cope, was higher among individuals aged 35 to 74, ranging from 92% of adults aged 35 to 44 to 93% of adults aged 45 to 74.
In contrast, 87% of those aged 16-24 and 84% of those aged 75 and above expressed similar readiness to help in the Community Empowerment theme. The number of people who believed they could influence decisions affecting their local area was fairly consistent across all age groups and aligned with the Scotland average of 18%. However, the perception that the neighbourhood is a place where local people take action to help improve the area tended to increase with age. For example, 59% of those aged 16-24 held this view, compared to 67% of those aged 45 and over.
Volunteering is more common in middle age groups
Social participation in the form of volunteering was generally more visible among middle-aged groups. Overall, respondents aged 35 to 74 were the most likely to say they had undertaken any kind of volunteering (formal or informal) in the last 12 months. Half of respondents (50%) aged 45 to 59, 48% of 60 to 74 year olds and 47% of 35 to 44 year olds had volunteered, compared with 41% of respondents aged 16 to 24, 44% of adults ages 25 to 34 and 34% of respondents aged 75 or over.
The formal volunteering rate was similar between age groups, with roughly 1 in 5 respondents of all age groups saying they had volunteered in the last 12 months.
Sex
In 2022, women reported stronger social networks than men. For instance, 88% of women believed they could rely on a neighbour for help, compared to 85% of men. Similarly, 82% of women, versus 79% of men, felt they could turn to neighbours for advice or support. Women also engaged in social interactions more frequently, with 71% meeting socially at least once a week, compared to 67% of men. Despite this, women reported higher levels of loneliness than men (24% vs 22%) (Figure 20).
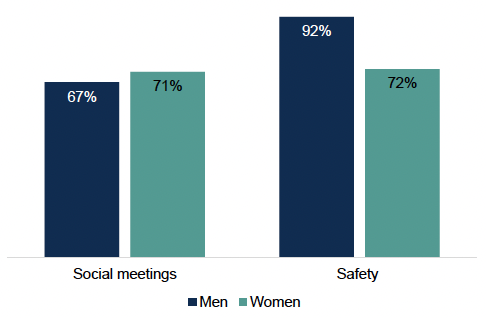
Percentage of adults who meet socially with friends, relatives, neighbours, or work colleagues at least once a week and percentage of adults who feel 'very' or 'fairly' safe when walking alone in their neighbourhood after dark, by sex, 2022, Scotland
Community cohesion experiences differed by sex. Women felt a stronger sense of belonging to their neighbourhood (84%) than men (81%). However, men felt significantly safer when walking home alone after dark (92% vs 72%) (Figure 20). Additionally, more men perceived their neighbourhood as a place where people can be trusted (83% vs 81%) and as having spaces to meet and socialise (59% vs 56%).
“If I have been to a concert this means that I have missed the last subway home. As a woman I often don't enjoy walking home at night, especially when it is dark in the evenings.” (Respondent from the free-text survey commenting on the places where they can access or take part in cultural activities, 2024).
Men and women were equally likely to undertake formal volunteering in the past year. However, women were more likely than men to say they had done informal volunteering (38% compared with 34%) as well as any type of volunteering (47% compared to 44%).
Ethnicity
White Scottish people have the highest sense of belonging, with all other groups falling below the national average. Sixty-seven per cent of minority ethnic groups[47] and 67% of people from a 'White: other’ background’[48], feel a sense of belonging to their community. In contrast, 86% of White Scottish people have a strong sense of belonging. The sense of belonging is 79% among White: Other British groups (Figure 21).
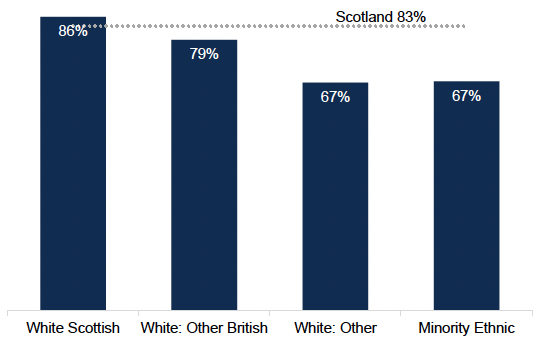
Percentage of adults who feel a 'very' or 'fairly' strong sense of belonging to their community by ethnicity, 2022, Scotland.
Fifty per cent of minority ethnic people and 47% of ‘White: Other’ groups rate their neighbourhoods as a ‘very good’ place to live, compared to 57% of White Scottish and 68% of White: Other British.
Minority ethnic groups are also less likely than ‘White: Other British’ groups to agree there are places to meet and socialise in their neighbourhoods (52% of minority ethnic groups, compared to 62% of White: Other British). Fifty-seven per cent of ‘White Scottish’ people and 56% of people in the ‘White: Other’ group, agree there are places to meet and socialise.
Perceptions of safety were highest for adults from a ‘White: Other British’ background. Eighty-seven percent of adults from a ‘White: Other British’ background felt ‘very’ or ‘fairly’ safe walking home in the dark in 2022. This compares to the national average of 81%. Perceptions of safety amongst the other ethnic groups were similar and ranged from between 79% and 82%.
Tenure[49]
Owner-occupiers are more likely to rate both their neighbourhoods and their neighbours positively than those who socially or privately rent. Two-thirds (65%) of owner-occupiers rate their neighbourhood as a ‘very good’ place to live. This is higher than both social renters (37%) and private renters (48%) (Figure 22).
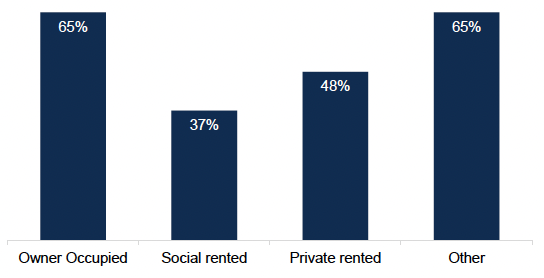
Percentage of adults who rate their neighbourhood as a 'very good' place to live by tenure, 2022, Scotland
Owner-occupiers are more likely than renters to agree that they live in neighbourhoods where others can be trusted (89%, compared to 68% of both social and private renters) and where people are kind (91%, compared to 78% of social renters and 77% of private renters). They are also more likely to agree that people from different backgrounds get along well together, with 76% of owner-occupiers holding this view, compared to 69% of both social and private renters.
Owner-occupiers are also much more likely to agree that local people take action to improve the neighbourhood (70%, compared to 47% of social renters and 53% of private renters).
People who privately rent are least likely to feel a very or fairly strong sense of belonging to their community, at 68% (compared to 77% of social renters and 87% of owner-occupiers).
People who socially rent report fewer places to meet and socialise. Under half (48%) of people who socially rent agree there are places to meet and socialise in their neighbourhoods, compared to 60% of both owner-occupiers and private renters.
Household type
Loneliness is highest in homes where there is only one adult, compared to adults from other household types. Forty-two per cent of single pensioners, 39% of single adults and 39% of single parents report feeling lonely some, most, almost all or all the time in the past week. This compares for instance to 17% in homes with large families and large adults, and 16% in older smaller households (Figure 23).
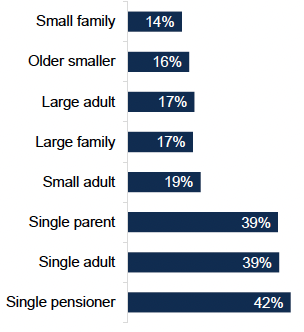
Percentage of adults who feel lonely 'some', 'most', 'all or almost all' of the time in the past week by household type, 2022, Scotland
Summary
The findings show how the national figures for social capital mask differences between different places, different communities and different subgroups of the population.
Social capital is not evenly distributed across physical locations. Although the majority across Scotland rate their neighbourhood as a good place to live, there is variation on many measures of social capital. This includes differences between local authorities, between more and less deprived areas, and between urban and rural settings.
Deprivation impacts on many of the measures of social capital, with consistent differences between people living in the most and least deprived areas of Scotland. Whether people live in urban and rural settings also affects social capital, with those in rural areas often scoring higher on measures than those in large urban or other urban settings.
There are differences between different subgroups of the population. These show inequalities in social capital for key groups, including by age, sex, disability, ethnicity, household type and tenure. Although outside the scope of this report, there are intersectional effects: people are shaped by multiple, interconnected social categories (such as sex, ethnicity and poverty). These interact and create additional barriers and disadvantage.[50]
Contact
Email: socialresearch@gov.scot
There is a problem
Thanks for your feedback