Social capital and community wellbeing in Scotland
This report provides information about the extent and nature of social connections and social capital in Scotland from 2018/2019 - 2022. It draws on a range of data, from both the Scottish Household Survey and qualitative research, to explore social capital in Scotland.
4: Changes in Social Capital since 2018-19 at a national level and for population subgroups
The COVID-19 pandemic and the cost of living crisis had large potential impact on social capital in the UK and Scotland.
The social capital index shows changes over the time period when these tool place, to show changes between 2018 / 2019 and 2022.[51] It is not possible to determine the specific effects of events on the social capital trends, but they prompt questions for the future, about changes in the dynamics of community life, where people spend their time, the support they receive through social interactions in neighbourhoods, workplaces and facilities and services.
This section begins with a summary of changes at the national level. It then explores key changes across four subgroups where inequalities in social capital exist: deprivation, age, disability, and sex.
Changes at national level
The overall social capital index score has maintained at similar levels between 2019 and 2022. However, there have been changes within the four themes. Community Cohesion, Social Networks and Community Empowerment have all increased (with a particular increase in Community Cohesion), whilst Social Participation (volunteering) has decreased (see Annex A for more detail).
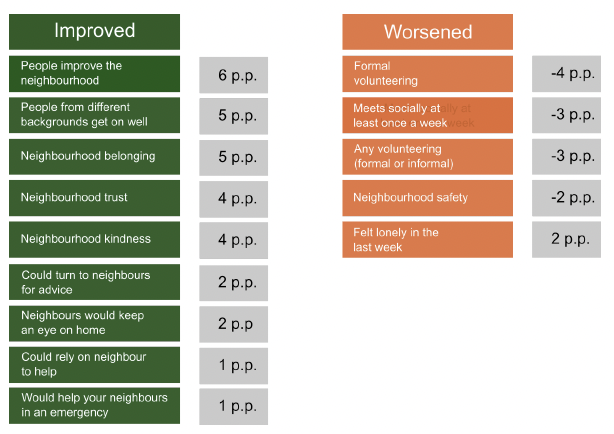
Percentage point change in agreement of the statements within the Social Capital Index that have significantly increased or decreased, 2018 / 2019 -2022, Scotland[52]
Improved
- People improve the neighbourhood: 6 p.p.
- People from different backgrounds get on well: 5 p.p.
- Neighbourhood belonging: 5 p.p.
- Neighbourhood trust: 4 p.p.
- Neighbourhood kindness: 4 p.p.
- Could turn to a neighbours for advice: 2 p.p.
- Neighbours would keep an eye on home: 2 p.p.
- Could rely on a neighbour to help: 1 p.p.
- Would help neighbours in an emergency: 1 p.p.
Worsened
- Formal volunteering: -4 p.p.
- Meets socially at least once a week: -3 p.p.
- Any volunteering (formal or informal): -3 p.p.
- Neighbourhood safety: -2 p.p.
- Felt lonely in the last week: 2 p.p.
People feel more positively about their neighbours
Between 2019 and 2022, there were notable changes in Community Cohesion. In particular, more now agree that people from different backgrounds get on well together (74%, an increase of five percentage points from 69%). People feel a greater sense of belonging to their community (83%, an increase of five percentage points from 78%) (Figure 24).
Trust in the neighbourhood also rose from 79% to 82%, and the perception of kindness among neighbours improved from 83% to 87%.
However, people feel less safe than they did in 2019. Eighty-one per cent feel safe when walking alone after dark, down from 83% in 2019. This is the only measure in the Community Cohesion theme to decrease.
There has also been no change in the availability of places to meet and socialise or welcoming places to meet new people. This suggests that nationally, improvements relate to the people living in neighbourhoods rather than the physical spaces to meet.
People meet socially less often and are lonelier, but can turn to their neighbours more
People are meeting socially less frequently than in 2018. There was a decline in the numbers of people who meet weekly, from 73% in 2018 to 69% in 2022. The percentage of people who felt lonely in the past week increased, from 21% in 2018 to 23% in 2022.
However, from 2019 to 2022 the proportion of people who could turn to neighbours for advice grew from 78% to 81%, the largest increase in this theme. The percentage of people who felt they could rely on a neighbour for help also increased (from 85% to 87%), and those who believed neighbours would keep an eye on their home rose similarly from 85% to 87%.
Volunteering has fallen
Formal volunteering decreased from 26% in 2019 to 22% in 2022 (down four percentage points), while the percentage of adults who had done any type of volunteering (formal or informal) decreased slightly from 48% in 2018 to 46% in 2022 (down by three percentage points).
The overall decrease in any type of volunteering (formal or informal) is due to the reduction in formal volunteering. However, thirty-six per cent took part in informal volunteering which has maintained since 2018.
People are more likely to agree others take action to improve their neighbourhoods
There have been large improvements in agreement that local people take action to improve their neighbourhoods, which increased from 57% in 2019 to 64% in 2022 (an increase of 6 percentage points).
However, the percentage of people who felt they could influence local decisions remained unchanged, at a very low 18%.
“Community means knowing I can rely on another person. That makes me feel better and improves my mental health. It’s not just about sharing an occasional evening together, it’s bigger than that.” (People’s Panel member reflecting on what community means to them, 2022)
Changes for different population subgroups
National trends can often mask significant shifts in social capital within specific groups. This section highlights key changes across four subgroups – deprivation, disability, age, and sex – focusing on the measures that have undergone the most significant changes.
Deprivation
There were no significant changes in the Social Networks theme for both the most and least deprived areas in Scotland between 2018 / 2019 and 2022. However, notable shifts occurred within the Community Cohesion theme for these groups. See Table 1, Table 2 and Table 3 in Annex B for detailed breakdowns of the changes between 2018 / 2019 and 2022 for Deprivation.
For example, a stronger sense of neighbourhood belonging grew in both groups, with a slightly larger increase among the least deprived (a six percentage point rise, from 81% to 88%) compared to the most deprived (a five percentage point rise, from 70% to 75%). Both groups also saw improvements in their perceptions of getting along with people from different backgrounds, with a significant increase among the most deprived (an 11 percentage point rise, from 57% to 69%) compared to a smaller increase for the least deprived (a three percentage point rise, from 76% to 79%) (Figure 25).
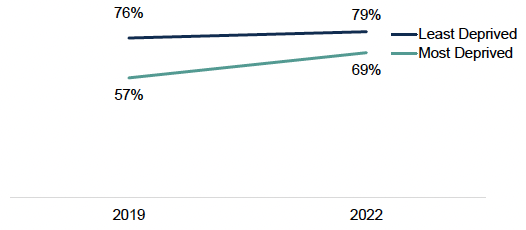
Percentage of adults who agree that people from different backgrounds get on well together, by SIMD Q1 and Q5, 2019 - 2022, Scotland
However, experiences in other areas of Community Cohesion varied more between these groups between 2019 and 2022. Neighbourhood trust improved significantly among the most deprived, with a five percentage point increase, from 60% to 64%. Perceptions of kindness also saw a significant improvement in the most deprived areas, rising five percentage points, from 71% to 76%. The least deprived areas experienced no significant change in these areas over this period.
On the other hand, the least deprived group saw a significant increase in the availability of welcoming spaces to meet new people, with a six percentage point rise, from 57% to 64%, while the most deprived group saw no change. Feelings of safety declined in the least deprived areas, dropping four percentage points, from 93% to 89%, with no change among the most deprived. However, the perception of safety remained lower in the most deprived areas, at 68%.
Both the most and least deprived groups experienced a decline in formal volunteering. The least deprived group saw a more significant drop, decreasing by six percentage points from 33% to 27%, while the most deprived group experienced a smaller reduction of three percentage points, from 16% to 14%.
The percentage of people in the least deprived areas who agreed that people take action to improve the neighbourhood increased from 69% in 2019 to 76% in 2022, an increase of seven percentage points. Agreement amongst adults in the most deprived areas maintained at a lower 43% (Figure 26).
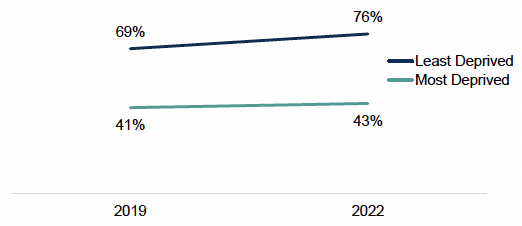
Percentage of adults who agree that local people take action to improve the neighbourhood, by SIMD Q1 and Q5, 2019 - 2022, Scotland
Disability
Between 2018/19 and 2022, the Social Networks theme showed more improvement for non-disabled people. They experienced significant positive changes in their ability to rely on neighbours for help (a two-percentage point increase, from 86% to 88%), neighbours keeping an eye on their home (a two percentage point increase, from 85% to 88%), and turning to neighbours for advice or support (a two percentage point increase, from 80% to 82%). In contrast, disabled people did not experience any significant changes in these areas.
However, both disabled and non-disabled people saw a significant decrease in the frequency of meeting socially at least once a week. The decline was more pronounced for disabled people, with a five-percentage point drop (from 68% to 63%), compared to a three-percentage point decline for non-disabled people (from 74% to 71%).
Both disabled and non-disabled people experienced significant improvements in several aspects of community cohesion. For example, the sense of belonging to the community increased by three percentage points for disabled people (from 77% to 79%) and by five percentage points for non-disabled people (from 78% to 84%). Perceptions of kindness in the neighbourhood improved by five percentage points for disabled people (from 78% to 82%) and by four percentage points for non-disabled people (from 84% to 88%). Similarly, the ability to get along with people from different backgrounds improved by five percentage points for disabled people (from 64% to 69%) and by four percentage points for non-disabled people (from 71% to 76%).
However, the experiences in other areas of Community Cohesion varied more between these groups. For example, the perception of safety in the neighbourhood worsened for non-disabled people, with a two percentage point decrease (from 88% to 87%), while there was no significant change for disabled people in this area, whose sense of safety remained consistently lower throughout the period.
Conversely, trust in the neighbourhood improved significantly for non-disabled people, increasing by five percentage points (from 80% to 85%). In contrast, there was no significant change in neighbourhood trust for disabled people, and their levels of trust remained generally lower (Figure 27). Non-disabled people also rated their neighbourhood as a good place to live higher compared to the pre-pandemic period, with a one percentage point increase (from 95% to 96%).
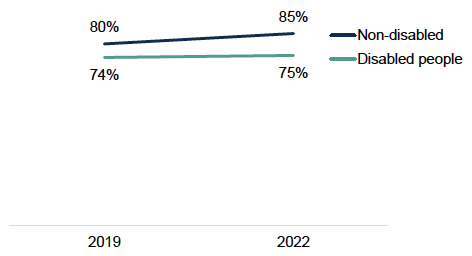
Percentage of adults who agree that most in their neighbourhood can be trusted, by disability 2019 - 2022, Scotland
Social participation through formal volunteering declined for both disabled and non-disabled people between 2019 and 2022. Among disabled individuals, participation dropped by two percentage points, from 20% to 17%. Non-disabled individuals experienced an even larger decline of five percentage points, from 28% to 23%. In contrast, participation in any type of volunteering (formal or informal) decreased only for non-disabled individuals, falling by three percentage points, from 50% in 2018 to 46% in 2022. Participation in any type of volunteering for disabled adults maintained at lower 43%.
There was also a significant increase in the perception that people are taking action to improve the neighbourhood among both groups. This perception rose by five percentage points for disabled individuals, from 52% to 57%, and by seven percentage points for non-disabled individuals, from 59% to 66%.
See Table 4 in Annex B for detailed breakdowns of the changes between 2018 / 2019 and 2022 for Disability.
“Online communities should be growing. There are people who will never be able to go back to how it was. Some of us can’t go out anywhere unless we are willing to take the risk.” (People’s Panel member reflecting on what community means to them, 2022).
Age
There have been notable changes across various social capital measures, with some age groups experiencing more pronounced changes than others. See Table 5, Table 6 and Table 7 in Annex B for detailed breakdowns of the changes between 2018 / 2019 and 2022 for Age.
The quality of social networks improved for some age groups between 2019 and 2022, but there were also concerning declines for others.
Regarding positive changes in social networks, more improvements were noted among older age groups. Adults aged between 60-74 experienced strengthened community bonds, with an increase in the belief that neighbours could be relied upon for help and to watch over their homes, rising from 90% to 92%. Additionally, the percentage of individuals aged 75 and older, who would offer help to their neighbours in an emergency, increased from 80% to 84%. Among younger age groups, adults aged 25-34 saw a significant rise in the percentage of people who could turn to neighbours for advice, increasing from 71% to 76%.
However, there has been a concerning decline in social interactions in adults aged 25 to 34 and 45 and over between 2018 and 2022. Weekly social meetings decreased from 74% to 68% for adults aged 25 to 34, from 66% to 62% for those aged 45 to 59, from 75% to 72% for those aged 60 to 74 and from 77% to 73% for those aged 75 (Figure 28). The percentage of adults who met socially at least once a week maintained for both 16 to 24 year olds and adults aged 35 to 44.
“My sick father keeps asking for me, but I can’t afford to get to him.” (People’s Panel meber reflecting on the impact of the cost of living crisis, 2022)
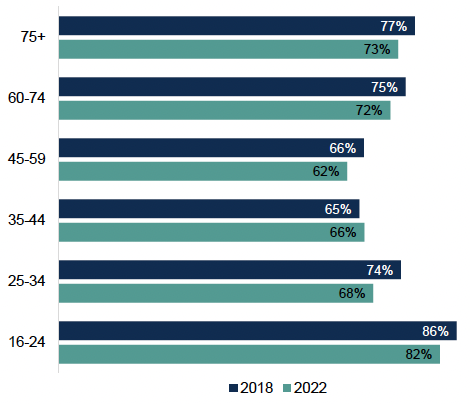
Percentage of adults who meet socially with friends, relatives, neighbours, or work colleagues at least once a week, by age, 2018 – 2022, Scotland
At a Scotland level, the percentage of people who felt lonely in the last week increased from 21% in 2018 to 23% in 2022. However, the only age group to see an increase in loneliness over this period was those aged 60 to 74.
Twenty-two per cent of adults adged 60 to 74 felt lonely in 2022 an increase of 4 percentage points since 2018. The levels of loneliness in the other age groups maintained over this period.
The sense of community cohesion saw widespread improvement, with significant changes skewed more towards younger age groups. There was a notable increase in the sense of belonging to the neighbourhood between 2019 and 2022, with adults aged 16 to 24 reporting a rise from 71% to 80%, adults aged 25 to 34 from 68% to 75%, adults aged 35-44 from 75% to 80%, and those aged 45 to 59 from 80% to 84%. No significant changes were observed for adults aged 60 and over.
Similarly, trust within neighbourhoods improved significantly for younger age groups since 2019, with adults aged 16 to 24 seeing an increase from 68% to 75% and those aged 25 to 34 from 70% to 77%. Perceptions of kindness among neighbours also saw widespread improvement over this same period, with the most significant changes for adults aged 16 to 24 (increasing from 77% to 86%) and those aged 25 to 34 (increasing from 78% to 83%). Additionally, the belief that people from different backgrounds get along well saw a significant rise for adults aged 16 to 24 since 2019 (increasing from 64% to 73%) and those aged 25 to 34 (increasing from 65% to 73%).
Community empowerment experienced a notable shift, with a widespread rise in the perception that people are taking action to improve the neighbourhood. Significant increases were observed across every age group other than those aged between 35 and 44.
Among younger adults, those aged 16-24 saw an increase from 44% to 59%, and those aged 25-34 from 51% to 57%. Although the increases were smaller, older age groups also noted positive changes, with those aged 45-59 rising from 61% to 67% and those aged 75+ from 62% to 67%.
Social participation through formal volunteering declined for many of the age groups between 2019 and 2022. The biggest decrease was for those aged between 45 and 59 where participation fell from 28% to 23%. Participation in formal volunteering fell from 24% to 19% in 25 to 34 year olds, 30% to 24% in 35 to 44 year olds and 205 to 16% in adults aged 75 and older.
For those aged between 16 and 24 and 60 to 74 participation maintained. Similar declines were not seen across age groups for participation in any type of volunteering (formal and formal) between 2018 and 2022 with a decline in participation only seen for those between 35 and 44. Participation in any type of volunteering (formal or informal) was maintained for the other age groups over this period.
Sex
Between 2019 and 2022, the Social Networks theme showed more improvement for women than for men. For instance, the proportion of women who could rely on a neighbour for help increased from 86% in 2019 to 88% in 2022. Similarly, the percentage of women who could count on a neighbour to keep an eye on their home rose from 85% to 87%. Furthermore, the percentage of women willing to help their neighbours in an emergency increased from 89% to 91%. These figures have all maintained for men over this period for these measures.
While women reported feeling lonelier than men in 2022, there was no change in women’s loneliness since 2018. In contrast, men reported a notable increase in feelings of loneliness, with a rise of three percentage points, from 19% to 22% over this period (see Figure 29).
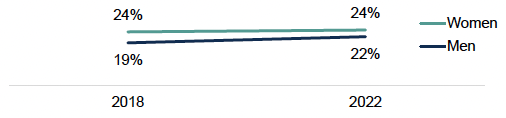
Percentage of adults who felt lonely 'some', 'most', 'all or almost all' of the time in the last week, by sex, 2018 – 2022, Scotland
However, both men and women experienced a similar decrease in the frequency of meeting socially at least once a week between 2018 and 2022, with a decline of three percentage points for each sex (Figure 30).
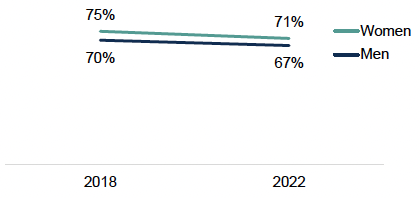
Percentage of adults who meet socially with friends, relatives, neighbours, or work colleagues at least once a week by sex, 2018 – 2022, Scotland
Although Community Cohesion has improved for both sex between 2019 and 2022, men have generally experienced slightly greater gains. For example, both men and women reported significant increases in their sense of belonging to their neighbourhoods, with men seeing a five-percentage point rise (from 76% to 81%) and women a four-percentage point rise (from 79% to 83%). Trust in the neighbourhood also grew, with men reporting a four-percentage point increase (from 79% to 83%) and women a three-percentage point increase (from 78% to 81%).
The biggest improvement for men in this theme, since 2019, was the increase in the perception that people from different backgrounds get along well. With men noting a six-percentage point increase (from 69% to 75%). Women had a four-percentage point increase over this period (from 69% to 73%).
However, there is a concerning trend regarding safety. While men’s feelings of safety when walking alone after dark remained stable between 2019 and 2022 at 92%, women experienced a decline in their sense of safety, with a decrease of four percentage points (from 76% to 72%) (Figure 31).
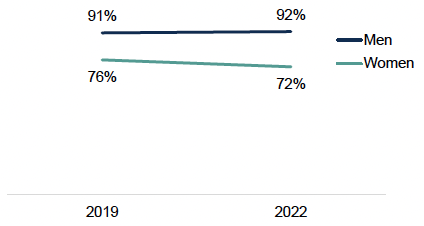
Percentage of adults who feel ‘very’ or ‘fairly’ safe walking alone in their neighbourhood in the dark, by sex, 2019 – 2022, Scotland
In terms of Social Participation, formal volunteering decreased for both men and women between 2019 and 2022. However, the decline was more significant for women, from 28% to 22%. Participation for men dropped from 24% to 21%. Conversely, participation in any type of volunteering (formal or informal) only decreased amongs women since 2018, with women’s participation going from 50% to 47%.
In the Community Empowerment theme, the perception of the ability to influence local decisions remained unchanged for both men and women between 2019 and 2022 at a low 19% and 17% respectively. However, there were significant improvements in how both men and women believe that people take action to improve the neighbourhood. Men reported a seven percentage point increase (from 57% to 64%), while women noted a five percentage point increase (from 58% to 63%).
See Table 8 in Annex B for detailed breakdowns of the changes between 2018 / 2019 and 2022 for Sex.
Discussion of post-COVID changes
There have been significant positive signs in measures of community cohesion and empowerment post-pandemic, and amid the cost of living crisis, across various regions and demographic groups in Scotland. However, challenges persist, particularly in maintaining social interactions and addressing loneliness. Despite improvements in some areas there are also ongoing inequalities.
Nationally there have been improvements in how people see their neighbours. This includes on measures such as neighbourhood trust and kindness, if neighbours could be relied on to help, and whether people take action to improve their communities. People feel a greater sense of belonging.
This may be a consequence of experiences during the pandemic. Social behaviours, such as experiences of help, or physical distancing behaviours may have strengthened perceptions of community help and cohesion. Restrictions for staying at home may have increased contact with neighbours and time spent locally. Homeworking in Scotland increased by over 200 per cent (up 544,000 people), the highest increase across the UK.[53] There may have been bonding and bridging effects of neighbourhoods coming together.
Though the pandemic also brought many hardships, and the cost of living crisis has further impacted communities and households, with some groups, such as those on the lowest incomes, disproportionately affected. Loneliness increased during the pandemic and by 2022 was still higher than in 2018. Levels of formal volunteering have fallen. There has been no change in the availability of places to meet and socialise.
Social interaction has decreased and this may be linked to cost of living pressures, or to reduced in-person contact during the pandemic having a lasting impact on how, and with whom, people choose to spend their time.
The report prompts questions about how and where society may have changed as a consequence of the pandemic, but it does not provide precise answers about the specific prompts or the longer term consequences of these for societal wellbeing. These societal changes are likely to be continuing and the statistics should help to inform an understanding of how society is changing in the future.
Contact
Email: socialresearch@gov.scot
There is a problem
Thanks for your feedback