Harbour and grey seals: distribution maps
This study presents updated at-sea distribution maps for both harbour and grey seals in Scotland to inform marine spatial planning. The maps are generated using regional habitat preference relationships derived from new tracking data and estimates of seal abundance.
2. Methods
2.1. Overview of Tracking Data
2.1.1. Deployments Under Current Project
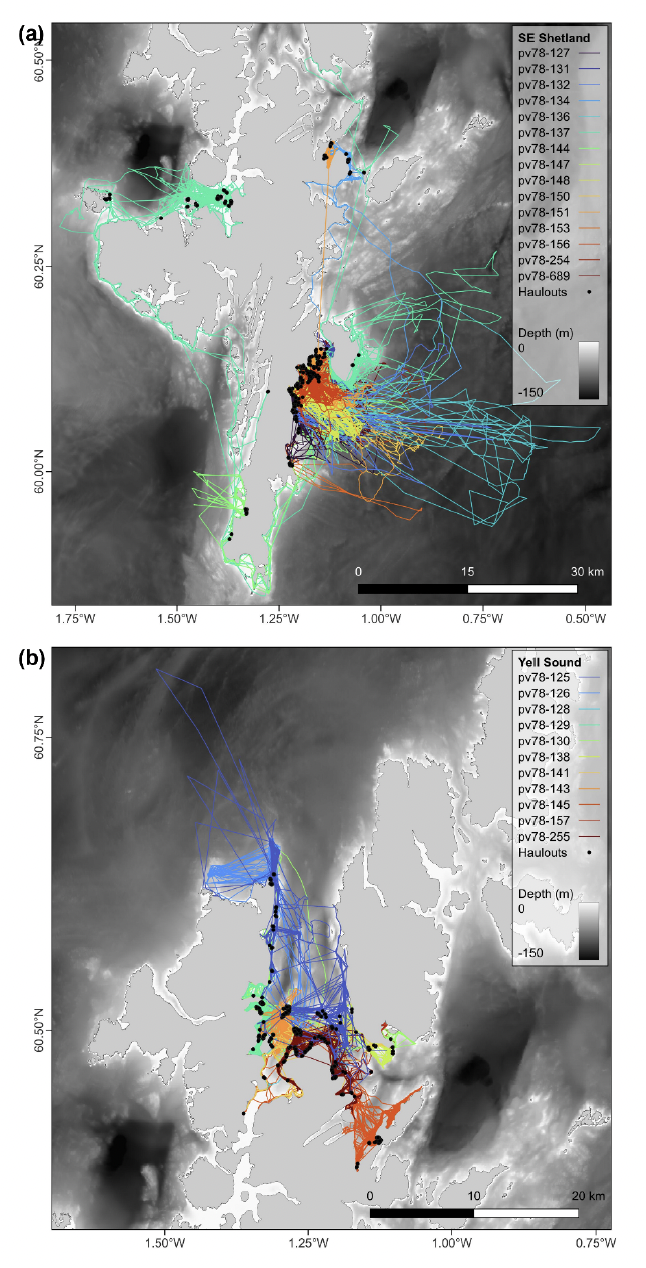
Under the current project, 29 Fastloc® GPS-GSM satellite telemetry devices (SMRU Instrumentation) were deployed on harbour seals in Shetland. The devices collect high resolution location information (accurate to < 70 m (Dujon et al., 2014)), as well as dive and haulout data, and transmit the data via Global System for Mobile Communications (GSM) mobile phone networks (McConnell et al., 2004). The original plan was to deploy all tags in early 2022, but persistent unworkable weather conditions coinciding with a lack of workable tides during daylight hours hampered fieldwork. As a result, the tags were deployed across Spring (n = 5) and Autumn (n = 25) 2022. Tags were deployed in two key areas of interest – Southeast Shetland and Yell Sound – representing the two harbour seal SACs (Fig. 1). Moreover, historic data from low resolution ARGOS tags deployed in 2003-2004 suggested little overlap in distribution of individuals hauling out in these two areas. Therefore, for accurate distribution estimates it was preferable to have tracking data from both centres of abundance. Given that very few harbour seals are now present in the Mousa SAC (Fig. 1), tagging was focussed more generally in the surrounding area of Southeast Shetland. Three of the tags did not transmit sufficient data to be of use for habitat preference modelling. The remaining 26 tags transmitted an average of 95 locations per day (one every 15 min) and lasted an average of 108 days. Figure 3 shows the tracks of seals tagged in Southeast Shetland (n = 15) and Yell Sound (n = 11). For plots by individual, see Appendices Section 8.1, Figures A1-A2. In addition to the harbour seal tags, nine GPS-GSM tags were deployed on grey seals in Shetland in Summer 2022, funded by NatureScot and DESNZ. All capture, handling and other licenced procedures were carried out under UK Home Office project licence PF84B63DE under the Animals (Scientific Procedures) Act 1986 with specific licences from the Scottish Government Marine Directorate (MD-LOT).
2.1.2. Existing Data
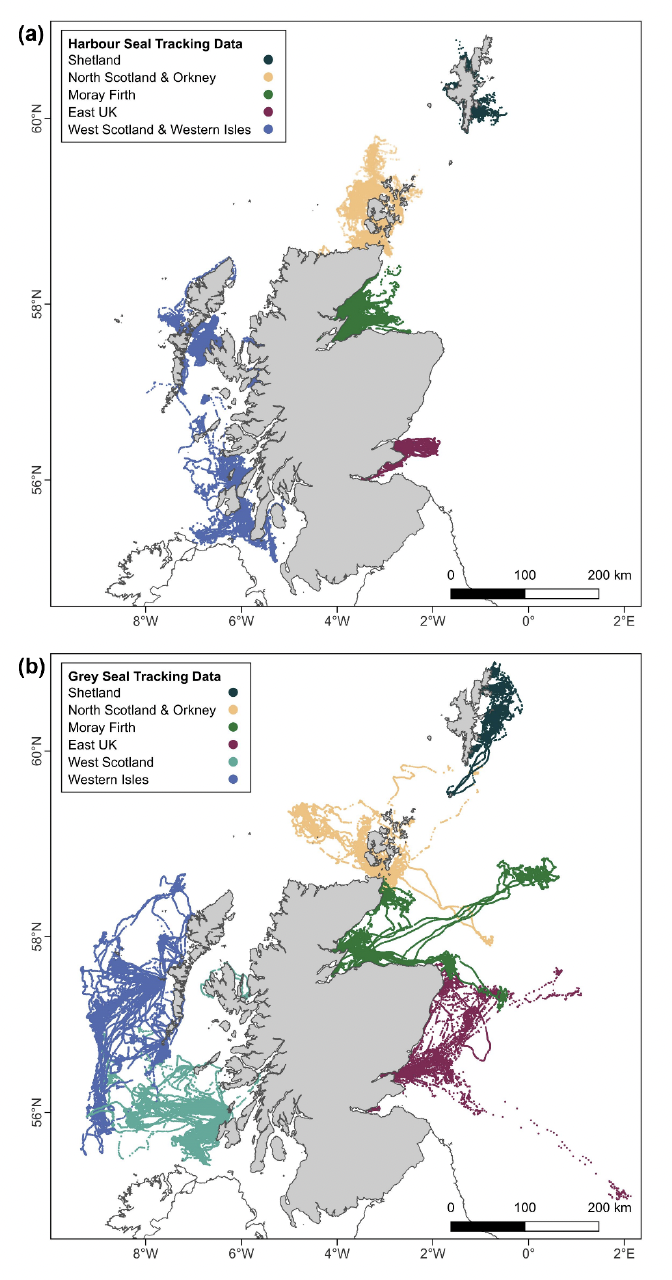
Data from the tags deployed on harbour and grey seals in Shetland in 2022 were combined with existing data from GPS-GSM tags deployed in Scotland and further afield. Models were fitted to discrete habitat preference regions (see Carter et al. (2022)) which were based on regional differences in movement patterns, habitat composition and diet, and do not align with national boundaries. As such, the tracking data used to fit the models required to predict distribution from haulouts in Scotland were from seals hauling out in Scotland and adjacent areas (Celtic and Irish Seas, and down the east coast of the UK to Flamborough Head). The movements of seals between regions allowed the use of data from seals tagged across the UK, Ireland, and France. In total, data from 222 harbour and 169 grey seals were used in this analysis. Data were provided by SMRU (UK), University of Aberdeen (Moray Firth), University College Cork (Ireland) and Université de La Rochelle (France). In contrast to Carter et al. (2022), Shetland was modelled as a sperate region to North Scotland and Orkney. A map of seal trips to and from haulouts in Scotland, colour coded by habitat preference region, is shown in Figure 4.
2.2. Habitat Preference Modelling
Methods for tracking data processing and habitat preference modelling broadly followed those of Carter et al. (2022), with a number of key differences which are outlined in the Discussion (Section 4.1). A comprehensive overview of methods relating to tracking data treatment and statistical analysis in habitat preference models is given in Appendices Section 8.2.
Contact
Email: ScotMER@gov.scot
There is a problem
Thanks for your feedback