International Development Fund - inclusive education programme: report
This report supports the development of the Scottish Government’s (SG) International Development Inclusive Education Programme, which will operate in Scotland’s International Development partner countries: Malawi, Rwanda, and Zambia.
Why invest in education for learners with disabilities?
There is increasing evidence showing a close link between poverty and disability with bidirectional cause and effect, wherein poverty causes disability and disability causes poverty (Braithwaite & Mont, 2009; Department for International Development, 2000; Eide & Ingstaad, 2013). Poverty may lead to, or exacerbate, disability through malnutrition, poor health care, and dangerous working or living conditions. Disability may lead to, or exacerbate, poverty through lost earnings, due to lack of employment or underemployment, and through the additional costs of living with disability, such as extra medical, housing and transport costs (WHO, 2011). Furthermore, there is an emerging evidence base showing that being female and being disabled intersects to cause further disadvantage (see for example, Christian Blind Mission - CBM, 2018).
People with disabilities are likely to experience multiple levels of poverty, increased care needs and other disability-related costs such as transportation and care support (Mitra et al., 2013; Mont & Nguyen, 2013), as well as lower educational attainment and poorer employment prospects (Groce et al., 2011, Mitra et al., 2013). In countries and areas where people with disabilities are among the most vulnerable, they are often the first to die when sanitary and food conditions become critical, least likely to get care when transportation cannot be paid for, or last to get jobs when employment is scarce. The scenario is further complicated when differing combinations of structural factors (such as caste, gender, religion etc.), life cycle factors (being young or elderly, household composition) and other idiosyncratic factors (ill health, accidents) intersect leading to different life experiences. Studies on women with disabilities in rural areas of many countries in the Asia-Pacific region have found that more than 80 per cent have no independent means of livelihood and are totally dependent on others (United Nations Economic and Social Commission for Asia and the Pacific - UNESCAP, 2003). Similarly, Pal (2010), referring to the Indian context, discusses how being a Dalit (someone from a lower caste) with a disability results in greater exclusion from mainstream processes. Groce et al. (2011a) point to the existence of a ‘feedback loop’ existing between poverty, disability and ill health in low‐income countries. Poverty, food insecurity and malnutrition all have an impact on the numbers of children and adults with disabilities in low-income countries.
In terms of the link between disability and education, a World Bank (2018) investigation in sub-Saharan Africa found an independent association between having a disability and educational exclusion. They found that people with disabilities were 8 percentage points less likely to ever enrol in education than their non-disabled counter parts. They also observed that the increase in completion rates at both the primary and secondary levels was at a slower rate for learners with disabilities; meaning the gap between those with and without disabilities is widening. For example, in 2018 they estimated 11- and 7-point completion rate gaps for boys and girls with and without disabilities respectively. Therefore, there is a clear need for investment in this area and studies have shown that the returns to education for learners with disabilities are at least the same and possibly higher than those observed for learners without disabilities (World Bank, 2018). As such, investors in this area will not only be supporting some of the most marginalised in society, but they will also see a high economic as well as social return.
Investment in this area has previously been restricted, due to a lack of data, which makes it difficult to understand the prevalence of child disabilities globally (IDDC and Light for the World, 2016). This, in turn, makes it difficult to target and justify investment. Nevertheless, there are some key sources, which provide insights. Namely, the United Nations Children’s Fund (UNICEF) Child Functioning Module data, the Global Burden of Diseases (GBD) Study, and meta-analyses of epidemiological prevalence studies. The key insights from these studies suggest the most common disability amongst children is Developmental Intellectual Disability (DID), followed by hearing and then vision (Figure 4), and that the prevalence of disabilities in children is higher in sub-Saharan African than other regions. For instance, UNICEF (2021c) estimates 6% of children 0-4 have a disability in Sub-Saharan Africa compared to 3.5% in Asia and Pacific region. Therefore, in addition to investment to improve country level data collection, support for learners with these types of disabilities in areas such as accessible infrastructure and assistive technologies would be a strong starting point.
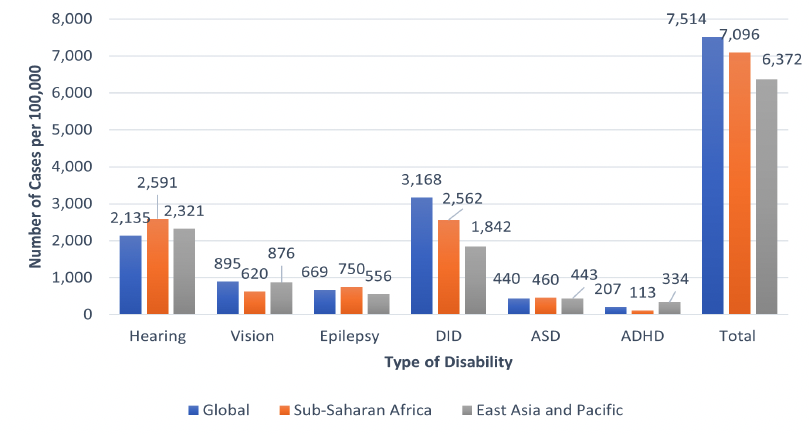
Source: Olusanya et al., 2022
There is also a case for interventions to support learners with disabilities that take a less ‘by disability’ focus. Namely, this would be the reduction of financial barriers to education. Both boys and girls face financial barriers to education in low- and middle-income contexts. However, the evidence suggests girls’ education is particularly contingent on household wealth, with families generally opting to finance boys’ education over girls if resources are scarce (Evans et al., 2023). As such, scholarship schemes, which either reduce the financial barriers for girls to attend education or create a financial incentive, have been shown to support girls to remain in school, which in turn increases their life chances. When this is considered in the context of COVID-19, which had disproportionate impact on girls, and the wider global recession, influenced by factors such as the war in Ukraine, there is a compelling argument to invest in scholarships for girls and other disadvantaged groups, like those with disabilities who will face substantial additional hidden costs to schooling. This is to ensure they do not fall behind and the global progress towards Sustainable Development Goals - SDG4 is not undone.
Why invest in education for learners with disabilities in partner countries?
Following initial inter-governmental conversations between the Scottish Government and the governments of Malawi, Rwanda and Zambia to identify priority focus areas for support on Inclusive Education, a targeted needs analysis was conducted in SG partners countries, with the aim to identify areas where the respective education systems need support to improve inclusivity. In all contexts, education for learners with disabilities stood out as an area in need of significant investment. Whilst the nuance of the specific support needs in each country and system were different, there are broad areas for action, which are consistent across all contexts.
First and foremost, a lack of robust data categories, collection processes, and monitoring and evaluation strategies has been identified as a significant need in all contexts. This feeds into every other area for action identified in this business case. This is because lack of robust data not only limits government, Civil Society Organisations (CSO), and donors’ ability to design and monitor evidence informed policies and interventions, but it has been highlighted by many stakeholders as an issue that has hampered investment in inclusive education. Secondly, the data available suggests that in all contexts, the number of learners decreases by every grade. There is a notable increase in dropouts at the transition point between primary and secondary level, with significantly fewer learners with disabilities enrolled in ‘regular’ secondary education. Thirdly, educational infrastructure and resources were also highlighted as a barrier to education in all contexts. Whilst there was a lack of in-depth publicly available data showing the scale of the issue in all contexts, all governments recognise that the lack of facilities for learners with disabilities is stopping them accessing education, and for those who do enrol, a lack of assistive devices is barrier to learners being able to engage in quality education. In all contexts, cost is noted as a major issue. As such, there are opportunities for SG to demonstrate low-cost solutions in this area.
In all contexts, there is a need for improved identification and referral mechanisms for people with disabilities. Such mechanisms are essential to ensure learners get the support they need in order to enrol and stay in education. All countries are at different stages in the development of these tools, and support needs vary between contexts. Teacher training was also a cross cutting theme between partner countries. In all contexts there has been a significant improvement in training teachers in additional support needs (ASN) education. However, government and stakeholders recognise there is still a large gap to fill. As all three countries have introduced ASN into their teacher training curriculums, donor attention should turn to those teachers who have already completed their training. The evidence indicates in-service training for teachers would be welcomed by stakeholders, government, and teachers themselves in all contexts. Finally, gender. Being a girl was also highlighted as a factor of multiple deprivation, meaning that being both a girl and having a disability is of a particular disadvantage. This means any interventions in support of people with disabilities should mainstream a gender equalities approach and ensure girls needs are addressed. An overview of the three partner country contexts is detailed below.
Malawi – Overview
Source: MoE, 2021
Source: MoE 2021; Ministry of Education Science and Technology - MoEST, 2019
Source: MoE, 2021
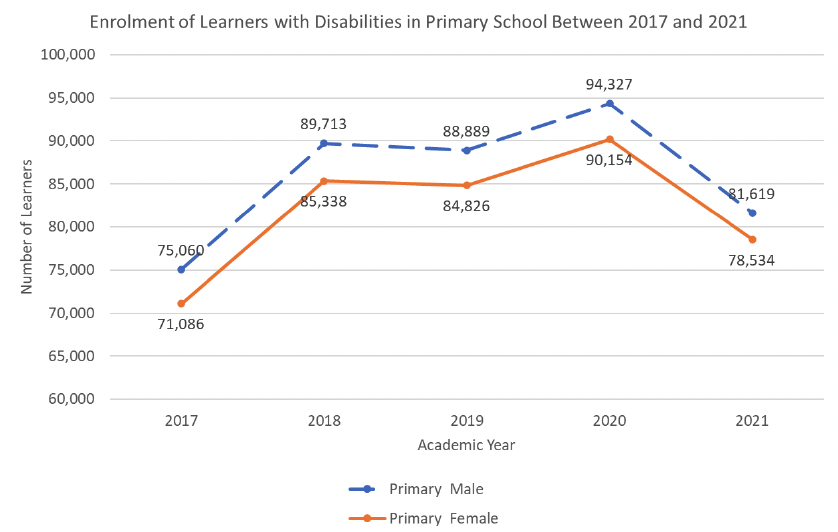
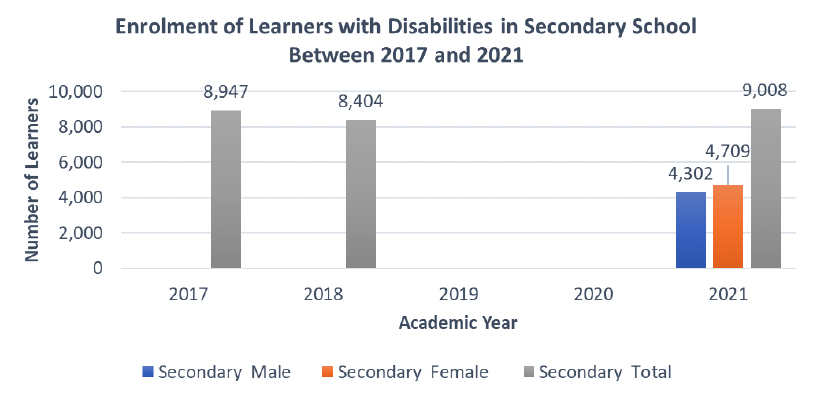
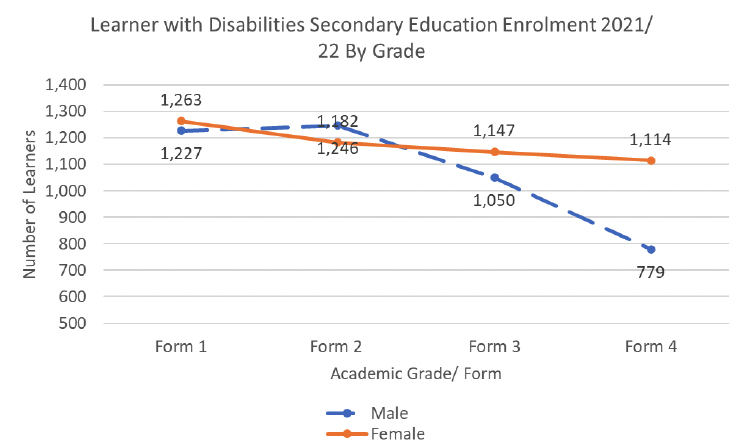
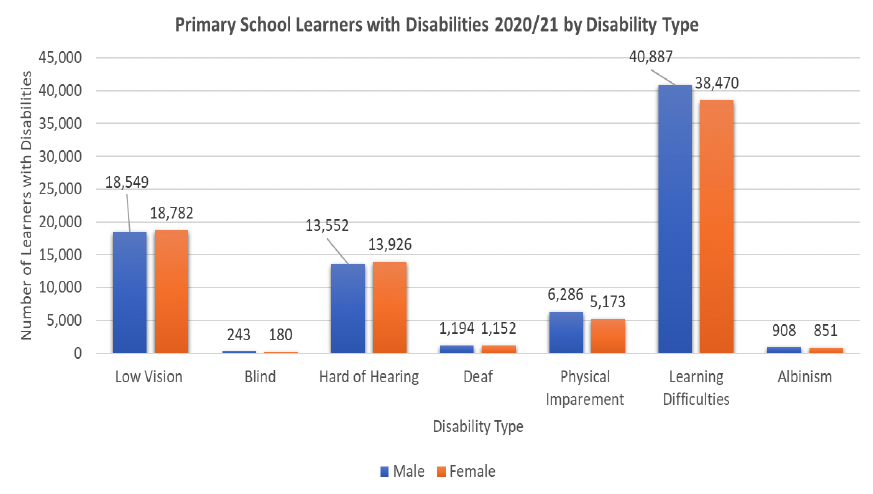
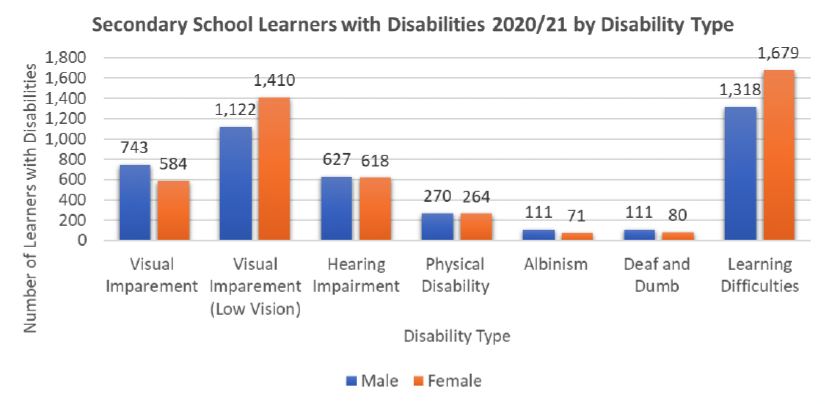
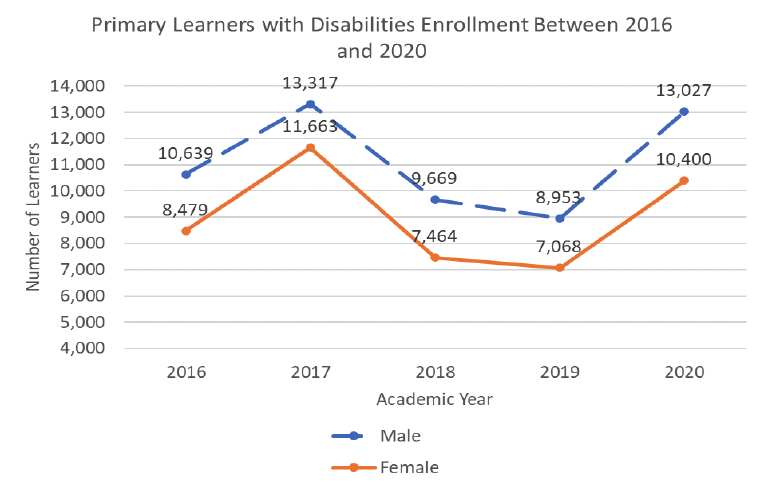
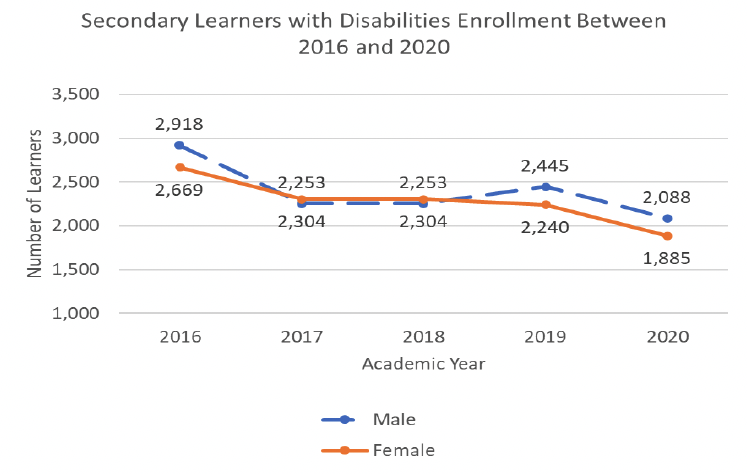
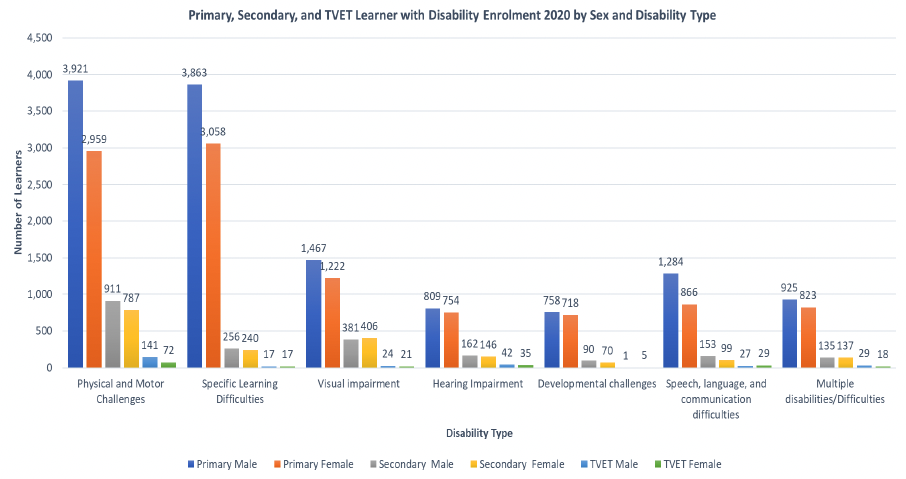
According to the 2018 NSO Housing and Population Census, Malawi has 332,990 children with disabilities, 227,814 aged 5–14 and 105,176 aged 15-19. This means children with ASN are estimated to be between 15% and 18% of the total number of children in Malawi. Whilst disabled learner enrolment trends show signs of improvement, increasing from 1.9% all enrolments in 2008 to 3.4% in 2018, they are still low and a significant number of learners are out of school (MoEST, 2019). Figures 5 and 6 highlights this well, showing that in 2018 only 55% of those children of school age were enrolled. The chart also suggests that if you are male and have a disability, you are more likely to be enrolled in school than if you are female. However, this is difficult to qualify without further data on the distribution of disabilities between the genders within the school aged population. Furthermore, the small amount of evidence available suggests that all learners with disabilities struggle to transition through the system to higher levels of education. This is illustrated well by figures 5, 6, and 7, which together show a significant difference in enrolment at the primary and secondary level for learners with disabilities (secondary enrolment being only 6% of primary), and the snapshot of secondary enrolment in 2021/ 22 indicates that learners with disabilities drop out as the grades increase. The government produces data on learners enrolled in education by disability type and gender (see figure 8 and 9). The most prevalent disabilities are amongst boys and girls at primary and secondary are learning difficulties, followed by low vision. However, support may be needed to develop a more consistent approach to defining and collecting disability data, as categories were not consistent across primary and secondary school data and definitions were not provided in the statistics bulletin (MoE, 2021).
Source: MoE, 2021
Source: MoE, 2021
Policy Context in Malawi
In Malawi, the government have signalled their commitment to inclusive education and ensuring the educational rights of disabled learners are realised. This can be seen in a number of key policies and legislation. For example, the 2012 Disabilities Act includes a clear definition of inclusive education and commits the government to ‘addressing and responding to the diversity of needs of all learners’ (Government of Malawi - GoM, 2012). The government has established the Directorate of Special Needs Education, which manages the provision of ASN education, leads on integrating learners with disabilities into regular education, and crucially conducts early identification and needs assessments for them. Nevertheless, in spite of the strong policy base, the National Education Sector Investment plan 2020-2030, has identified that there is underinvestment for improving the education of children with ASN, and the 2019 Education Sector Analysis recommends the establishment of directorate for inclusive education, to promote and manage inclusive education at all levels of the system. Furthermore, the monitoring and evaluation data available is insufficient to assess how effective the implementation of the current policies has been. As such, additional support is needed in this area.
In terms of resources, there are some signs of improvement. The budget for special needs education increased by MK611 million (480,325 GBP) between 2020/21 and 2022/23, to MK642 million (504,695 GBP). However, this is still only 46% of the amount requested by the Ministry of Education (MoE) to procure the teaching and learning materials for ASN learners, training of teachers, early identification and assessment of learners, monitoring, and development of inclusive education policy. The issue of monitoring policy implementation is particularly pertinent in the case of Malawi, as there is some evidence to suggest they are not following through and allocating financial resources to projects outlined in their investment plans (UNICEF, 2022b). Nevertheless, participants in our stakeholder consultation noted that the GoM has now created a sub-division dedicated to disability inclusion in education under the National Education Sector Investment plan with a team made up of experts that have worked in institutes that specialise in the area of children with disabilities. The consultations also identified that UNICEF Malawi has been working closely with the Ministry of Education and Ministry of Health to develop a new program identifying children with disabilities and so far, 180,000 children have been screened and 250 children have been referred. A number of stakeholders identified a weakness in policy implementation due to a lack of financial and human resources as well as competing priorities in the sector – including responding to natural disasters. There was also a clearly identified need to invest further in training at all levels of the system. Donor support for this area has been low in the past due, in part, to the lack of reliable data and evidence to identify the needs.
Infrastructure in Malawi
Providing adequate infrastructure to ensure an education system accessible to all remains a challenge in Malawi. The student to classroom ratio is high, with the majority of districts being over 100:1 ratio at the primary level in 2017 (MoE, 2020). Nevertheless, the government have taken positive steps by mandating that all schools are accessible to students with disabilities. This is supported by the Education Infrastructure Management Unit, who provide guidelines on disability friendly infrastructure. However, the data available only tends to focus infrastructure changes for learners with physical disabilities; namely ramps and disability friendly toilets. Whilst the number of classrooms with ramps increased by 41% between 2018 and 2021, in 2021 only 43% of permanent classrooms had them, and there were only 6,136 disability friendly toilets in schools (2,737 and 3,399 male and female toilets respectively). This equates to 0.93 disability friendly toilets per school, and it should be noted that these are not evenly distributed around the country. For example, Likoma district has zero disability friendly toilets (MoE, 2021). Furthermore, schools in remote areas are reported to lack any basic inclusive infrastructure at all (Norad, 2020). As such, the policy goal has not been realised and infrastructure is not disability friendly. This was recognised by the Ministry of Education, Science and Technology (MoEST) in their 2019 sector analysis, and, in their 2020 NESIP 2020 - 2030, they identified the lack of appropriate infrastructure as a key barrier to learners with disabilities’ participation. The main areas for action highlighted in the National Strategy on Inclusive Education strategy were the construction of inclusive classrooms, sanitation facilities, water points, and playgrounds (MoEST, 2017).
In the stakeholder consultations, it was raised that the lack of infrastructure data has hampered European Commission investment in ASN centres for secondary schools in Malawi, as they could not gain robust insights into how many centres would be effective. We also discovered other organisations in Malawi, such as Care, are looking to incorporate mixed approaches with all of their programs that consider inclusive education from programme inception with adapted services and infrastructure that cater for all of the students that they are working with. They noted the Education Joint Fund system is available to support organisations on the ground to help further facilitate this.
Education Resources in Malawi
There are insufficient resources available for learners with disabilities. The national education sector investment plan recognises that schools do not have the materials they need for effective instruction nor has sufficient investment been made in assistive technologies. Nevertheless, there are some examples of good practice in this area. The 2013-2016 Early Grade Reading Assessment (EGRA) programme in Malawi, had a specific workstream dedicated to supporting visually impaired children. This included developing in-country public- private partnerships to provide the necessary education resources, including Perkins Braillers (a form of typewriter for the blind), braille paper, and talking calculators. Furthermore, they held the first ‘Braille Cup’ in 2014. This was a braille reading competition intended to encourage reading skills in blind children and to both create a best practice network amongst practitioners and improve community engagement. The EGRA programme was relatively small, only reaching 548 primary schools (9% of the total) (USAID, 2016). Nevertheless, the assessment was helpful in identifying areas for future training and instruction. Specifically, the results indicated teachers needed to focus increased instructional time and effort in teaching the mechanics of braille reading and in braille reading and comprehension. Learners read well below what would be expected for their grade level, and therefore more explicit focus should be placed on the teaching of reading for learners who use braille. Global concerns trust and Malawi Council for the Handicapped (MACOHA) are currently working on producing resources for teachers that are training to help provide better awareness of disability in education and sign language so that teachers in the classroom are able communicate with all of their students regardless of their abilities. No gender disaggregated data was found for education resources and disabilities.
Education Staff Training in Malawi
The Malawi Education Sector Analysis 2019 recognises that there is an insufficient supply of trained ASN teachers in both mainstream and specialised educational settings. This can be attributed to the fact that whilst the 2013 National Education Policy tried to mainstream ASN and inclusive education, there is only one college training ASN teachers (about 100 every two years) (UNESCO, 2022b). This issue is further compounded by the uneven distribution of trained teachers around the country. The itinerant teaching programme has been set up to try and combat this (UNESCO, 2022b). This programme designates a specialist teacher to manage ASN learners in a number of mainstream schools and provides them with additional mobility support.
The government has recognised inadequate continuing professional development (CPD) and in-service training of teachers. This limits the opportunities for qualified to teachers to gain the skills needed to support students with ASN. The 2013-2016 EGRA programme highlighted a number of areas where teacher CPD could be effective for the visually impaired. For example, in the amount of time and effort dedicated braille reading and comprehension, supporting learners to reduce ‘scrubbing’ and developing the skills to read with two hands (USAID, 2016b). No gender disaggregated data was found for teacher training and disabilities.
Rwanda – Overview
Source: MoE, 2016; MoE, 2022b
Source: MoE, 2016; MoE, 2022b
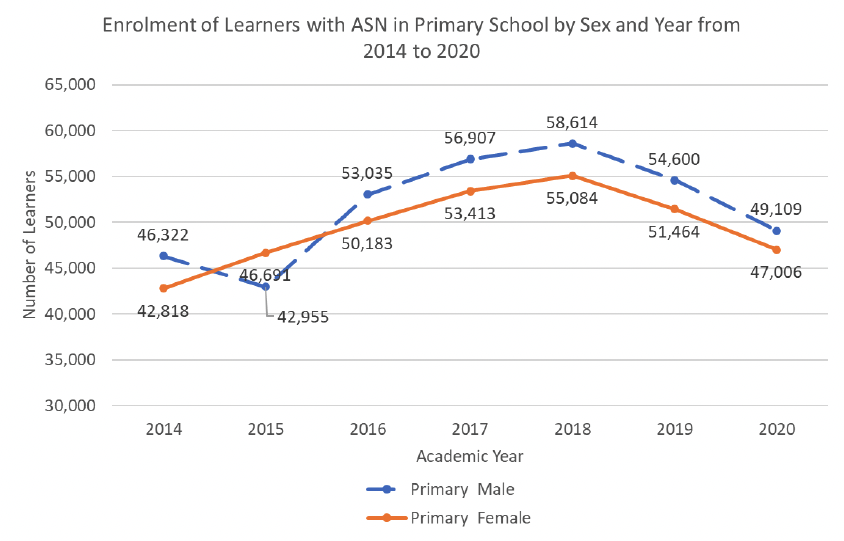
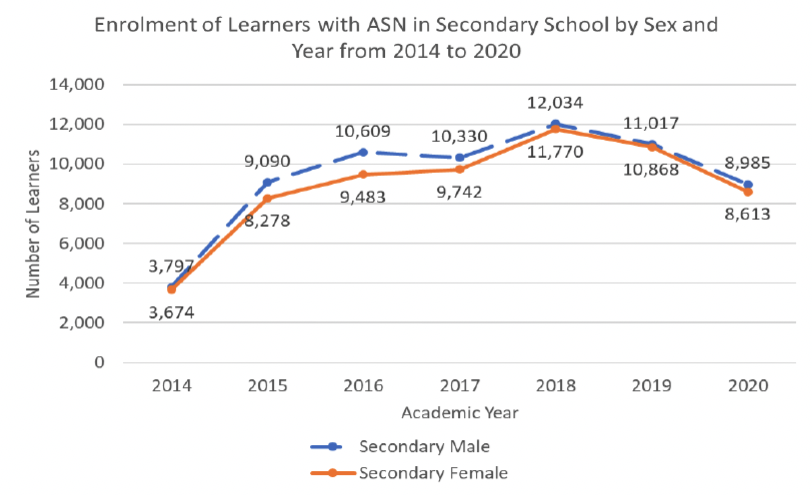
In 2020, there were 27,400 students with disabilities in the basic education system, with 23,427 in primary school (figure 10) and 3,973 in secondary school (figure 11). The available prevalence data is poor. However, to contextualise these figures, the Global Partnership for Education estimates that roughly one in three children with disabilities in Rwanda never attend school (GPE, 2021). The government has detailed data of learners with disabilities in schools, collecting information by grade, gender, and disability type. The main disability type at both levels is physical disability, followed by learning disabilities. This can be seen in figure 12.
Source: MoE, 2022b
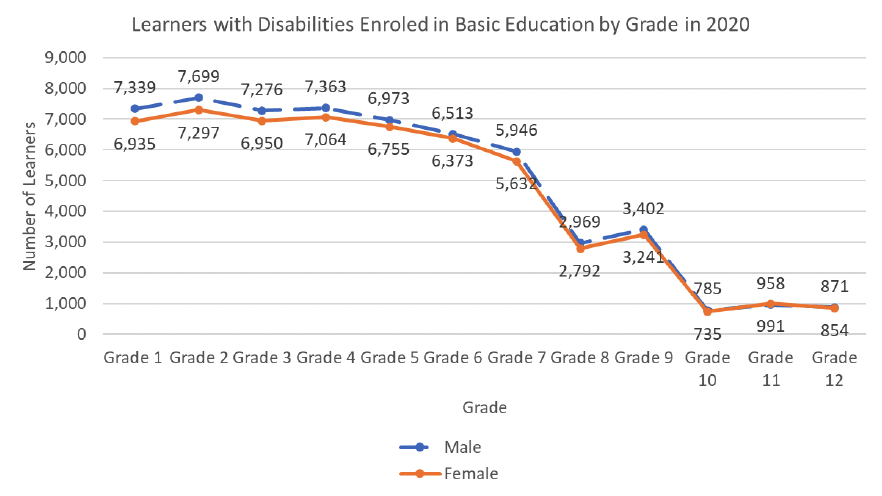
There are more disabled boys in the system than girls, with girls being underrepresented in schools compared to the proportion of girls with disabilities in the general population (CGD, 2022). The data demonstrates that learners with disabilities struggle to transition through the system to higher levels of education, with the number of learners with disabilities decreasing in every grade (MoE, 2018). This is illustrated well in Figure 13.
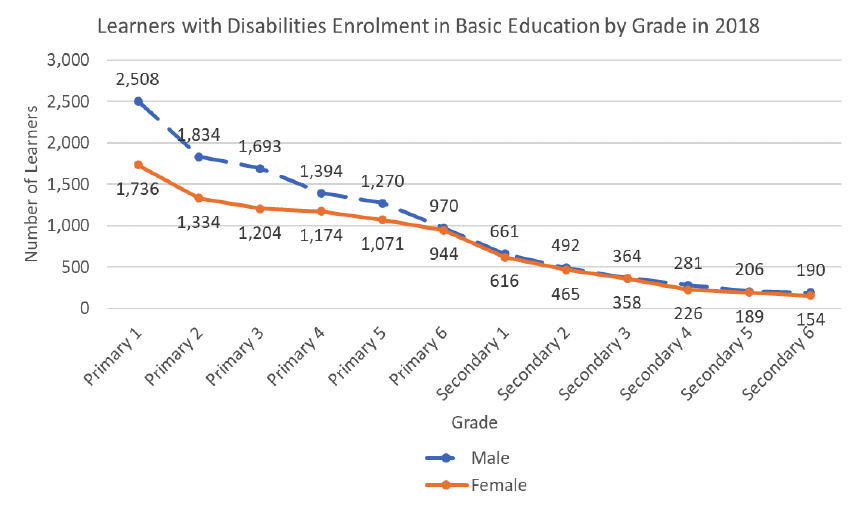
Source: MoE, 2018
Policy Context in Rwanda
The Ministry of Education is responsible for inclusive education policy and has developed a number of policies to ensure people with disabilities’ equity within education. For example, the 2018 Revised Special Needs and Inclusive Education Policy. However, official documents suggest there is currently no formal mechanism to assess and identify those learners with ASN. Nevertheless, our stakeholder consultations highlighted that the government is currently assessing two different screening and referral mechanisms, with the intention to combine and implement them. This is an area SG may be able to add valuable input. Furthermore, the broader monitoring and evaluation of inclusive education policies is ineffective (MoE, 2018b). This suggests the countries approach would benefit from further clarity, to ensure learners with disabilities get the support they need.
It was noted in our consultations that there is not a section in the education sector plan specifically for inclusive education, but it is currently being mainstreamed. This is likely building on the Revised Special Needs and Inclusive Education Policy (2018b). There are also tools being made available by the government such as School Improvement Plan that dedicates leadership training and provides some outcome data for schools but has yet to be completed and integrated in to mainstreaming schooling. So, one of the organisations in the consultation shared they are continually querying how the data that is produced is being used to improve inclusive education on the ground. It was also mentioned there had been some focus on girls and inclusion previously, but it seems to have faded recently given the other pressures on the system such as COVID and the global financial crisis. The ministry seems to be focused more on inputs and not system strategy.
Infrastructure
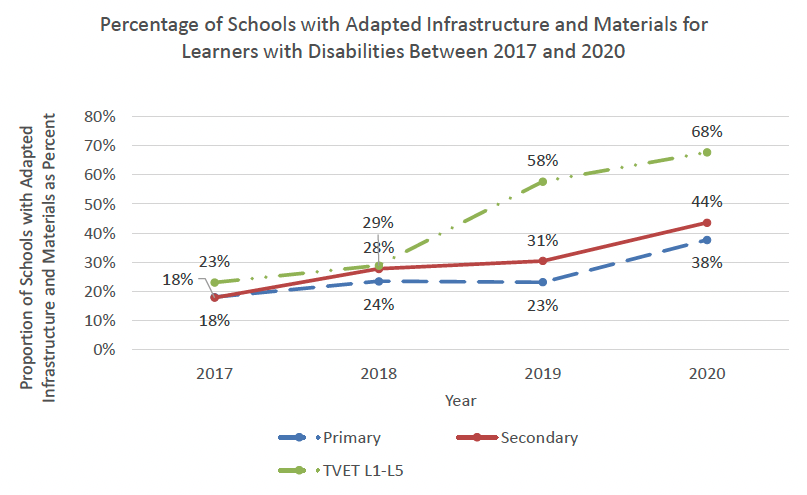
Source: MoE, 2022b
Rwanda has been making progress in accessible infrastructure at all levels of education. This is demonstrated well in figure 14, which shows a positive trend between 2017 and 2020 in the adaptation of infrastructure and materials at all levels. In 2018, at both the primary and secondary levels they met and exceeded their infrastructure targets for learners with disabilities, with 28.6% of secondary schools meeting the standards of accessibility for those living with disability (target 26%) and 24% of primary (target 21%) (MoE, 2018). Nevertheless, this is still a small proportion of schools and, whilst the 2018/19 -2023/ 24 Education Sector Plan (2019) does plan to further develop facilities in mainstream and specialist schools, there are opportunities here for additional support. Furthermore, there is evidence to suggest that there are significant hidden costs associated with people with disabilities’ access to schooling. These range from purchasing of assistive devices and adapting learning materials, to hiring additional classroom support and increased food costs (World Bank, 2023). In terms of infrastructure, the most significant hidden costs are those associated with transport. There is evidence to suggest that Rwandan school transport infrastructure is not accessible for learners with disabilities, and learners with physical impairments are charged a premium to use motorised transport to commute to school (World Bank, 2023). The government does have financial benefits in place to support households with these hidden costs. However, the evidence available suggests that public awareness of these opportunities is low (World Bank, 2023). Our consultation with the Director General of the Ministry of Education mentioned that one of the biggest hurdles that the country faces is infrastructure, with only 10 ASN schools in the country. No gender disaggregated data was found for infrastructure and disabilities.
Education Resources in Rwanda
The data on the availability of additional resources for learners with ASN is poor. For example, hearing aids, adapted readers, or Braille paper. However, the evidence available suggests that there is a significant gap between the demand for assistive devices in the education system and the supply, with a particular need for those learners with hearing difficulties. Furthermore, the costs of assistive devices are not only a barrier for the individual or family in engaging in education, but also too high for many schools to purchase (World Bank, 2023). Nevertheless, the 2018/19 – 2023/24 Education Sector Strategic Plan does recognise the need for adapted learning materials for those with ASN, and it is one of the outputs to achieve increased participation and achievement of children with ASN at all levels (strategic priority 7.2) (MoE, 2019). This is an area where Scotland would be well placed to add value. For example, through demonstrating low-cost assistive device interventions. No gender disaggregated data was found for education resources and disabilities.
Education Staff Training in Rwanda
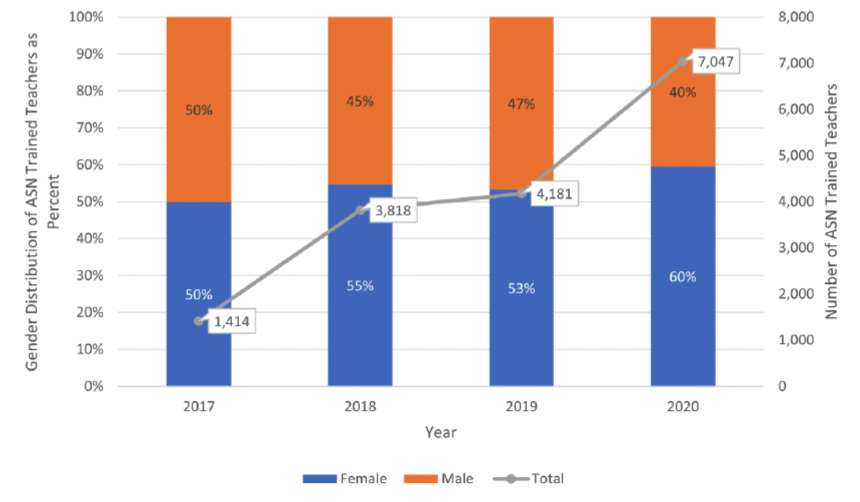
Source: MoE, 2022b
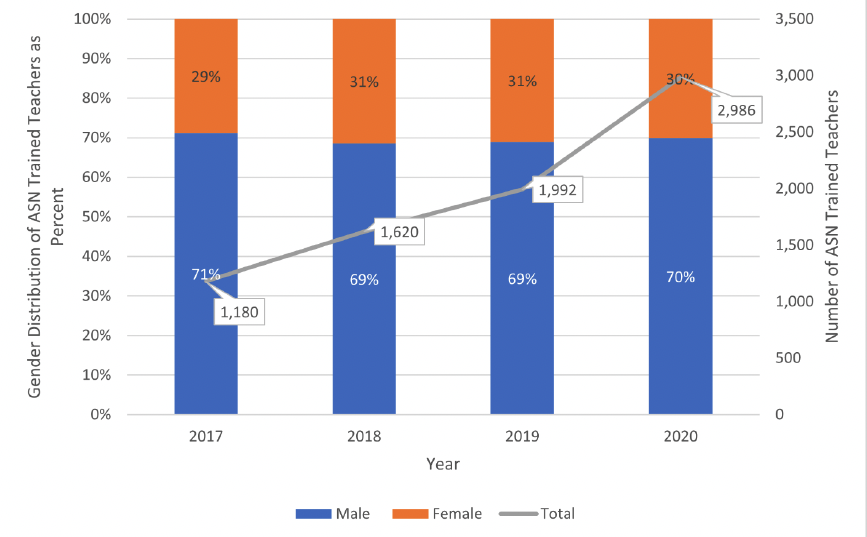
Source: MoE, 2022b
There are a number of notable positive developments in ASN teacher training. Firstly, the University of Rwanda’s College Education has begun to include modules of ASN and inclusive education into their teacher training programmes (MoE, 2018b). Secondly, following the ESP 2014-18, four guides were developed to support teachers to address the needs of children with disabilities. Thirdly, the government aims to standardise Rwandan sign language skills and develop associated teaching materials, to help schools to provide quality education to learners with hearing and speaking difficulties (MoE, 2018b). Finally, there is a positive trend in the number of teachers trained in ASN education, as can be seen in figures 15 and 16. At the primary level, between 2017 and 2020 there was a 398% increase in the number of ASN trained teachers (1,414 to 7,407), and at the secondary level, there was a 153% increase in the same period (1,180 to 2,986). Nevertheless, it should be noted that whilst the trend is positive, between 2017 and 2020 at both levels a roughly 7:3 ratio has been maintained in favour of male teachers being trained in ASN education. Furthermore, the 2018 Revised Special Needs and Inclusive Education Policy still highlighted the insufficient number of specially trained staff and more progress is needed.
The government recognised in the 2018/19 - 2023/ 24 Education Sector Plan the value of and need for teacher continued professional development and in-service training, particularly with the ASN area, and has committed to developing a range of opportunities. This is a possible area where Scottish university expertise could add significant value. In our consultation, one organisation mentioned their work on restorative justice and emotional capacity journeys for teachers when training and its positive effects. It was also noted that the one of the most effective ways to improve inclusive education in Rwanda would be to invest in dedicated teacher training for students with disabilities. They suggested that specialist training for teachers would be essential in growing this area further. They noted that one of the main gaps in teacher training is in the screening of children with hearing and sight impairments. This would allow teachers to pick up problems earlier and improve both the inclusivity of the system and the experience of the students.
Zambia – Overview
Source: MoE, 2020
Source: MoE, 2020
Source: MoE, 2020
In 2020, there were 113,713 students with disabilities in the basic education system, with 96,115 in primary school (figure 17) and 17,598 in secondary school (figure 18). The government has detailed data of learners with disabilities in schools, collecting information by grade, gender, and geography. However, it does not publish information on learners by disability type. Figure 15 suggests that boys with disabilities may have a slight advantage over girls in terms of enrolment. However, without gender disaggregated data on the prevalence of disabilities within the wider school aged population, this is difficult to substantiate The evidence indicates that learners with disabilities struggle to transition through the system to higher levels of education, with the number of learners with disabilities generally decreasing in every additional grade. This is illustrated well by the snapshot of the learner with disability enrolment in 2020 shown in figure 19, with a significant drop off at the transition point between primary and secondary education (grade 7 to 8). The 2015 Disability survey (2018) adds further insights. It finds there is an educational disparity between those with and without disabilities. It demonstrates that children with disabilities’ primary enrolment rates (95% vs 87%) and literacy rates (82% vs 67%) were lower than those without, and that they were more likely to engage in housework in their home or no activities at all. As such, there are significant equity concerns for learners with disabilities in Zambian education.
Policy Context in Zambia
The government has signalled its commitment to protecting the rights of people with disabilities. The 2012 Persons with Disabilities Act provides Zambia with a strong legal framework to protect people with disabilities’ rights. In educational terms, it also provides a number of additional rights. For example, the entitlement to an allowance to cover the additional costs associated with schooling and the right to education delivered through the most appropriate means of communication, such as sign language. The wider policy environment also demonstrates the government’s commitment to understanding the challenge and taking proactive action. For example, by commissioning the 2015 Disability Survey. Furthermore, the Ministry of General Education and the Ministry of Higher Education, regularly plan to take positive action to ensure people with disabilities’ equity within education in their sector plans. For example, in the latest Education and Skills Sector Plan 2017-2021 (2017), they commit to improving their approach to ASN assessment and needs analysis. Nevertheless, the lack of accessible monitoring and evaluation data makes it difficult to understand how effective the implementation of these policies has been. One organisation mentioned in the consultations a big challenge has been that there is no cohesion between policy and policy implementation. It was noted that Zambia’s education policy has been in preparation for the past few years and there have been challenges in implementing programs due to the change in government.
Infrastructure
Improved ASN infrastructure was included as part of the 2017- 2021 Education and Skills Sector Plan, in which the government committed to building a further three specialist schools. Unfortunately, however, with the data available it is difficult to understand the scale of the progress. This is because there is no indication of how many specialist classrooms and schools are needed to enable an inclusive education system. Beyond this, as in Rwanda, the available evidence suggests that the wider education infrastructure is not inclusive and learners with disabilities face higher transport costs than other learners to travel to school. Similarly, awareness of the financial support available for learners with disabilities was also low. However, it should be noted that these types of benefits are not extensive in Zambia. The support available includes social cash transfer programmes and benefits to support with transport costs, the hiring of assistive devices and personal assistants (World Bank, 2023). One organisation in the consultations shared that they believe the Zambian education system is failing children with disabilities in their education and highlighted the separation of mainstream and ASN schools as an issue. Stakeholders also noted that they felt better analysis and data collection on disabilities would be useful. Furthermore, they thought that practical support for wheelchairs and adaptive devices is an essential need. No gender disaggregated data was found for education infrastructure and disabilities.
Education Resources in Zambia
The data found on the availability of additional resources for learners with ASN was not extensive. However, the information available suggests that there is general lack of resources for students with disabilities and few resources adapted to support their specific requirements. Insights from the 2015 disability survey (n=1,006) suggest that there is low awareness amongst learners with disabilities of assistive technology. Of the 47% who were aware of them, 45% reported needing them and only 6% reported having them. This suggests there is a service gap of 86% (difference between reported demand and provision). There is a particular need to support learners with hearing difficulties within the system, and evidence to suggest that the assistive devices that are available tend to be distributed to ASN schools, rather than regular, which reduces the inclusivity of the system and opportunities for people with disabilities’ participation (World Bank, 2023). Furthermore, there is some evidence to suggest teachers spend large amounts of time adapting the standard curriculum to meet the specific needs of their students with disabilities (MoCDSS, 2018b). As such, there are opportunities to support the development and procurement of specialist curriculum and resources for learners with disabilities. For example, in the development of the new ASN education framework, which was committed to in the 2017- 2021 Education and Skills Sector Plan (MoGE & MoHE, 2017). No gender disaggregated data was found for education resources and disabilities.
Education Staff Training in Zambia
ASN education courses are integrated into part of the teacher training curriculum in colleges of education and universities. However, the Institute for Special Education (ZAMISE) is solely responsible for the specialised training of teachers in ASN and inclusive education at the early childhood and secondary level, with the University of Zambia able to provide specialist training at the secondary level. The evidence available suggests that there is an insufficient number of trained specialist teachers. This absence of specialised support combined with the government’s move towards inclusive education necessitates generalist teachers have both a good understanding of learners with disabilities’ needs and the necessary training to be able to adapt their resources.
The evidence available suggests teachers would welcome this training (MoCDSS, 2018b), and the ministry of education has shown it values teacher continued professional development in the latest sector plan (MoGE & MoHE, 2017). As such, this is a potential area for SG action and support. Stakeholders stated that in the last year over 30,000 teachers were deployed and only 44 were trained for ASN. As such, there is a strong need for more ASN training in teacher colleges. Nevertheless, stakeholders did mention that there has been an increase in the past 3 years of teachers trained in inclusive education and are still teaching in regular or non-ASN schools. No gender disaggregated data was found for education staff training and disabilities.
Contact
Email: socialresearch@gov.scot
There is a problem
Thanks for your feedback