International Development Fund - inclusive education programme: report
This report supports the development of the Scottish Government’s (SG) International Development Inclusive Education Programme, which will operate in Scotland’s International Development partner countries: Malawi, Rwanda, and Zambia.
Partner Country Education Finance
This section gives a brief overview of how partner countries finance their education systems and additional donor activities.
Malawi
Source: UNICEF, 2022b
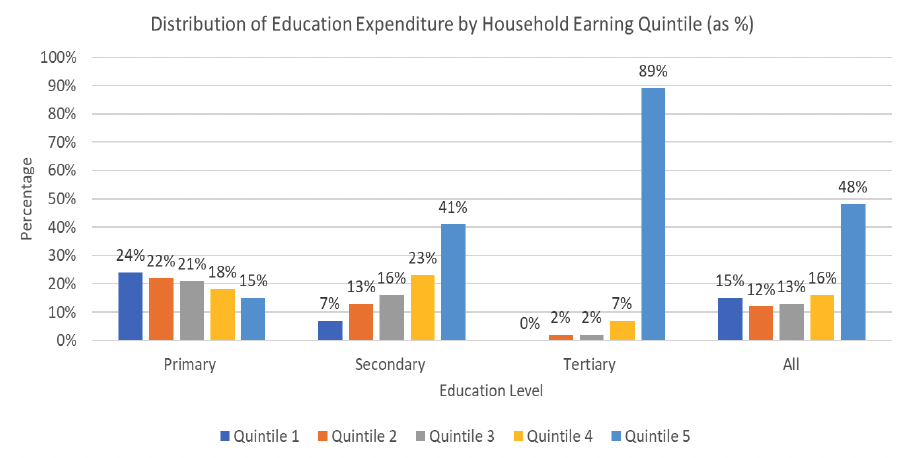
The government’s investment in education as a percent of GDP peaked in 2015 at 5.6%. However, it has declined since, accounting for only 2.9% of GDP in 2020 (World Bank, 2023). This is below the 4% regional average (UNESCO, 2022c). This means that the government in 2020 only funds 46% of the total costs of education, with donors and households funding the remaining 15 % and 39% respectively. Government funding largely covers recurrent costs of education and with only a small proportion of the budget being allocated to capital expenditure. In 2020, this can be broken down 89.8% recurrent and 3.3% capital, with donors covering the remaining 6.9% of budgeted expenditure (UNICEF, 2022b). The government is taking an increasingly decentralised approach to education funding. In 2021/22 48% of the budget was allocated to local authorities for distribution, with plans to increase this to 51% of total education expenditure by 2022/23 (UNICEF, 2022b). In terms of equity, a World Bank Benefit Incidence Analysis indicates that only 15% of government expenditure goes to the poorest quintile, while nearly half goes to the richest (UNICEF, 2022b). Figure 20 shows this well.
Source: FCDO, 2023.
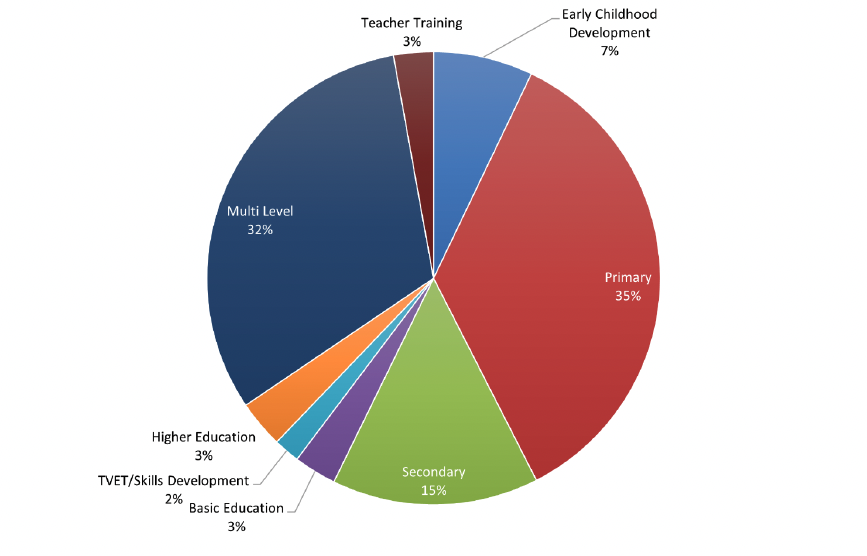
Aid commitments for education in Malawi in 2022 totalled just under US$800M. The largest donors are the World Bank (US$447M – IDA loans); the EU (US$170M); USAID (US$163M); Germany (US$72M); Norway (US$67.8M); FCDO (US$43.6M); and JICA (US$29M) (FCDO, 2023). As can be seen in figure 21, the majority of aid financing is targeted at the primary and secondary sub-sectors. Investment in tertiary education (TVET and HEI) is primarily from the multilateral agencies including the World Bank SAVE project to build labour force skills; EU STEP and Zanchito grant programmes supporting investments in infrastructure and equipment in TVET; and the AfDB Jobs for Youth Project. None of the major education programmes is listed as having a specific focus on learners with disabilities, although several programmes state a commitment to promoting inclusive education and reaching the most marginalised. Three programmes have a specific focus on girls’ education: FCDO supported Camfed and TeamGirl projects, and Norway supported Joint UN Programme for Girls.
Rwanda
Source: UNICEF, 2021
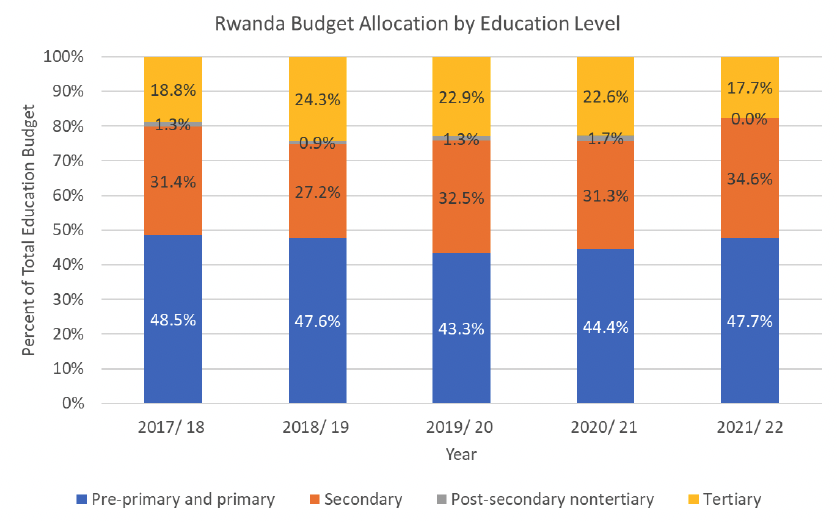
The government investment in education as a percent of GDP peaked in 2003 at 4.8%. However, investment is not consistent and accounted for only 3.1% of GDP in 2018. Nevertheless, investment remains close to the 4% regional average and the current trend is positive, increasing to 3.8% of GDP in 2021 (World Bank, 2023; UNESCO, 2022c). The government currently funds the majority of education system domestically. In 2021/22, the government only relied on external financing for 8.7% of the budgeted expenditure. This is a significant decrease from 2020/21 and 2019/20, where the government funded 26.2% and 21.8% of the system using external funds. However, this can be explained in part by the government’s engagement with the World Banks human capital development project, which led to significant government borrowing and receival of grants (UNICEF, 2021). The budget largely consists of recurrent expenditure. For example, in 2021/22 the budget was split 75.1% and 24.9% between recurrent and capital expenditure respectively (UNICEF, 2021). The education sector is the most decentralised sector in Rwanda and in 2021/22 59.3% of the budget was allocated to decentralised organisations. This is an increase 7.3% from the average between 2017/18 and 2020/21 (UNICEF, 2021). In terms of equity, in 2021/22 budget a greater proportion of finance was allocated to secondary education than in previous years, which can be seen in figure 22. This was taken from the tertiary education budget to support the government’s commitment to 12 years of basic education (UNICEF, 2021).
Source: Languille S, 2023.
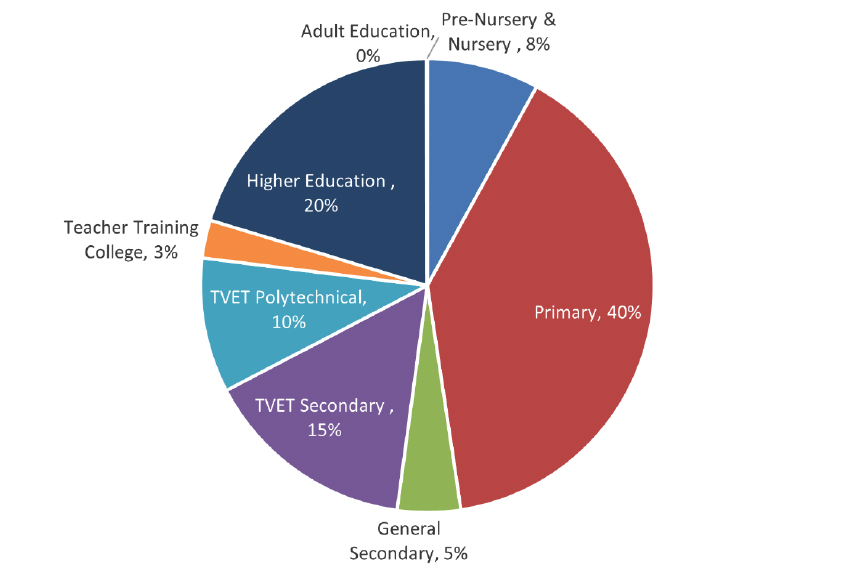
Aid commitments for education in Rwanda in 2022 totalled just under US$1BN (RwF1,080 BN). The largest donors are the World Bank / IDA and GPE (US$536M –loans); the EU (US$50M); USAID (US$42.9M); France / AFD (US$54.1M); Germany (US$64.2M); and UK / FCDO (US$100M) (Languille, 2023). As can be seen in figure 23, the majority of bilateral aid financing is targeted at the pre-primary, primary and secondary sub-sectors. However, there is also substantial multilateral Investment in tertiary education in particular the World Bank Skills for Growth project (US$242M). None of the major education programmes is listed as having a specific focus on learners with disabilities, although several programmes state a commitment to promoting inclusive education and reaching the most marginalised. Only one programme has a specific focus on girls’ education although most of the programmes include commitments to mainstreaming gender and ensuring gender equality across of the sector. MasterCard Foundation has a number of projects to improve secondary education including targeted scholarship programmes.
Zambia
The government’s investment in education as a percent of GDP fluctuates. Between 2010 and 2020 the average Zambian expenditure on education was 4.2% of GDP, which is above the regional average of 4% (World Bank, 2023; UNESCO, 2022c). The government does not fund the entirety of the system. The publicly available information on this is poor. However, reports suggest donors provide direct budget support, in addition to financing discrete projects (UNICEF, 2021b). In 2021, approximately three quarters of the education budget is allocated to recurrent expenditure. Whilst the overall budget execution rate averages at 90% between 2014 and 2018, there is a significant difference in the execution rate for recurrent and capital expenditure. Between 2014 and 2018, the execution rate for recurrent expenditure was 92%, whereas for capital expenditure it was only 67%. Therefore, the government is failing to mobilise the funding available to them. The majority of Zambia’s education spend is allocated to the primary level (55% in 2021). However, the per pupil expenditure is 1.2 times higher at the secondary level (UNICEF, 2021b).
Publicly available data on donor funding for the education sector in Zambia is poor. The OECD’s Development Assistance Committee Creditor Reporting System shows that external financing for education was around ZMW 612 million in 2021. With the 2023–2025 Medium Term Budget Plan (MTBP) stating that education sector spending was ZMW 119 billion in 2021, which would represent around 5 percent of total education sector financing. USAID and the World Bank account for around two thirds of this external funding with additional support provided by FCDO through the British Council.
Contact
Email: socialresearch@gov.scot
There is a problem
Thanks for your feedback